Estimated Value: $837,597 - $870,000
4
Beds
3
Baths
3,193
Sq Ft
$266/Sq Ft
Est. Value
About This Home
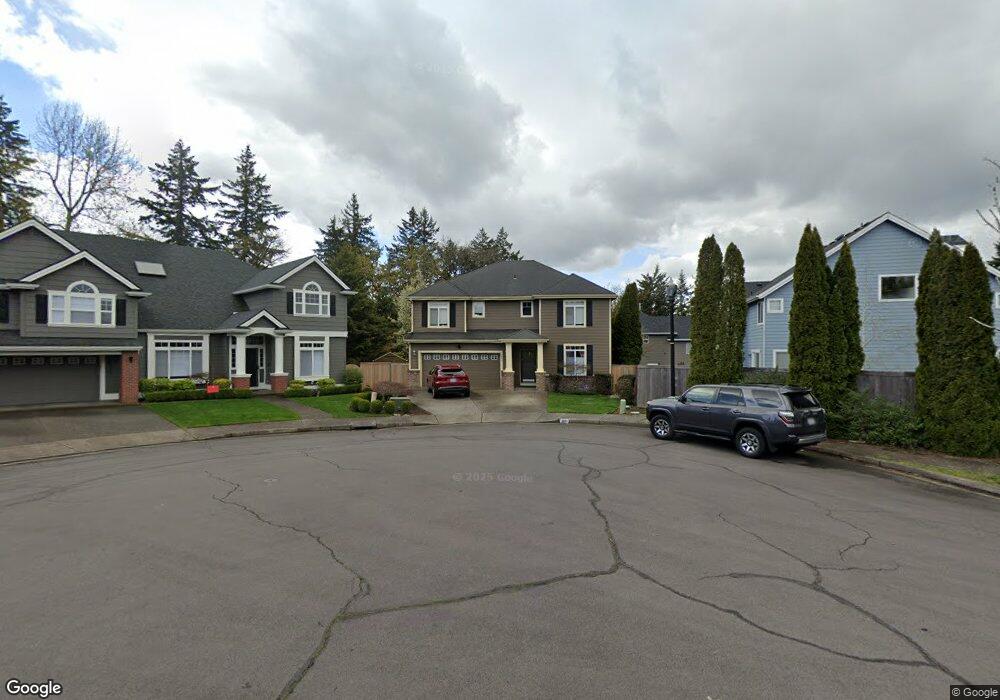
This home is located at 3851 NW 9th Loop, Camas, WA 98607 and is currently estimated at $848,399, approximately $265 per square foot. 3851 NW 9th Loop is a home located in Clark County with nearby schools including Prune Hill Elementary School, Skyridge Middle School, and Camas High School.
Ownership History
Date
Name
Owned For
Owner Type
Purchase Details
Closed on
Jul 23, 2003
Sold by
Roberts Daniel and Roberts Rebecca
Bought by
Reed Joel R and Reed Izumi N
Current Estimated Value
Home Financials for this Owner
Home Financials are based on the most recent Mortgage that was taken out on this home.
Original Mortgage
$269,600
Outstanding Balance
$113,497
Interest Rate
5.13%
Mortgage Type
Purchase Money Mortgage
Estimated Equity
$734,902
Purchase Details
Closed on
Aug 7, 2002
Sold by
D R Horton Inc Portland
Bought by
Roberts Daniel and Roberts Rebecca
Home Financials for this Owner
Home Financials are based on the most recent Mortgage that was taken out on this home.
Original Mortgage
$212,350
Interest Rate
6.43%
Create a Home Valuation Report for This Property
The Home Valuation Report is an in-depth analysis detailing your home's value as well as a comparison with similar homes in the area
Purchase History
| Date | Buyer | Sale Price | Title Company |
|---|---|---|---|
| Reed Joel R | $337,000 | First American Title | |
| Roberts Daniel | $265,453 | First American Title |
Source: Public Records
Mortgage History
| Date | Status | Borrower | Loan Amount |
|---|---|---|---|
| Open | Reed Joel R | $269,600 | |
| Previous Owner | Roberts Daniel | $212,350 | |
| Closed | Roberts Daniel | $26,500 | |
| Closed | Reed Joel R | $33,700 |
Source: Public Records
Tax History
| Year | Tax Paid | Tax Assessment Tax Assessment Total Assessment is a certain percentage of the fair market value that is determined by local assessors to be the total taxable value of land and additions on the property. | Land | Improvement |
|---|---|---|---|---|
| 2025 | $7,210 | $738,574 | $175,000 | $563,574 |
| 2024 | $7,308 | $756,464 | $234,500 | $521,964 |
| 2023 | $7,315 | $824,506 | $251,500 | $573,006 |
| 2022 | $7,151 | $784,833 | $239,600 | $545,233 |
| 2021 | $6,843 | $641,267 | $197,100 | $444,167 |
| 2020 | $7,235 | $568,687 | $175,000 | $393,687 |
| 2019 | $6,651 | $557,571 | $175,000 | $382,571 |
| 2018 | $6,783 | $545,986 | $0 | $0 |
| 2017 | $6,040 | $468,032 | $0 | $0 |
| 2016 | $5,602 | $453,868 | $0 | $0 |
Source: Public Records
Map
Nearby Homes
- 4030 NW Quinault St
- 845 NW Sacajawea St
- 3983 NW 64th Ave Unit 22
- 3983 NW 64th Ave
- 693 NW Halifax St Unit LOT 9
- 667 NW Halifax St Unit LOT 8
- 558 NW Halifax St Unit LOT 17
- 501 NW Halifax St Unit LOT 3
- 0 NW Halifax Unit Lot 6 24459237
- 645 NW Halifax St Unit Lot 7
- 533 NW Halifax St
- 0 NW Garden Ct Unit Lot 24
- 630 NW Halifax St Unit Lot 15
- 560 NW Brady Rd
- 580 NW Brady Rd
- 0 NW Brady Rd
- 600 NW Halifax St Unit LOT 16
- 645 NW Garden Ct Unit LOT 20
- 703 NW Garden Ct Unit LOT 19
- 538 NW Garden Ct Unit LOT 23
- 3855 NW 9th Loop
- 3922 NW 8th Cir
- 3904 NW 8th Cir
- 3859 NW 9th Loop
- 3930 NW 8th Cir
- 3863 NW 9th Loop
- 3856 NW 9th Loop
- 3946 NW 8th Cir
- 3917 NW 8th Cir
- 3901 NW 8th Cir
- 3901 NW 9th Loop
- 3911 NW 8th Cir
- 3860 NW 9th Loop
- 3867 NW 9th Loop
- 4002 NW 8th Cir
- 3864 NW 9th Loop
- 3830 NW 9th Loop
- 4005 NW 8th Cir
- 4001 NW 8th Cir
- 3871 NW 9th Loop
Your Personal Tour Guide
Ask me questions while you tour the home.