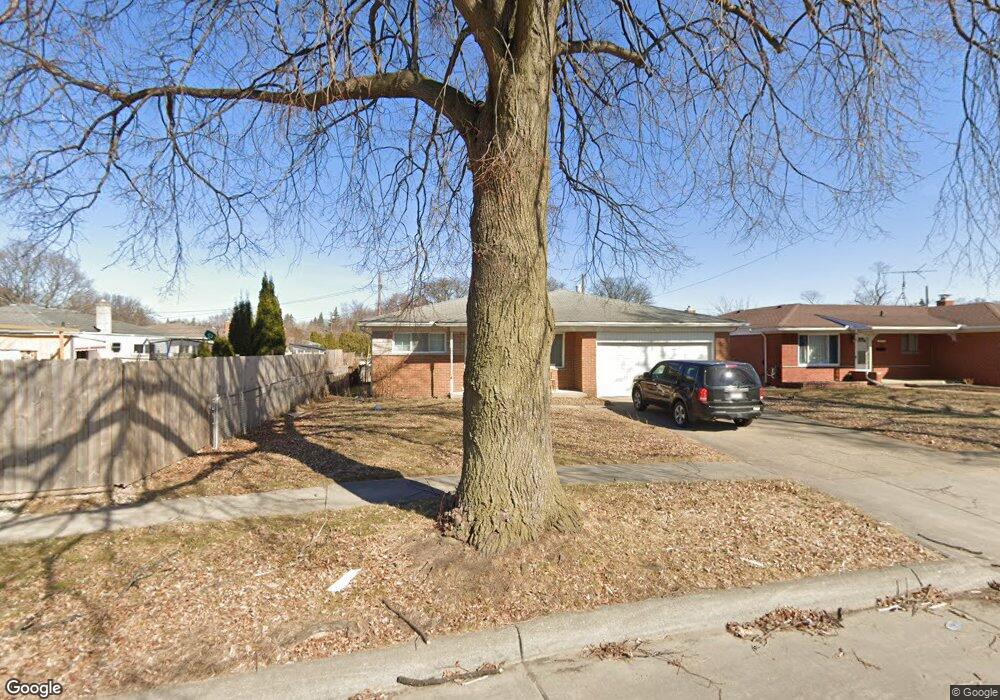
3851 Robertson Dr Warren, MI 48092
Northwest Warren NeighborhoodEstimated Value: $254,000 - $279,000
3
Beds
2
Baths
1,405
Sq Ft
$188/Sq Ft
Est. Value
About This Home
This home is located at 3851 Robertson Dr, Warren, MI 48092 and is currently estimated at $264,605, approximately $188 per square foot. 3851 Robertson Dr is a home located in Macomb County with nearby schools including Lean Elementary School, Beer Middle School, and Warren Mott High School.
Ownership History
Date
Name
Owned For
Owner Type
Purchase Details
Closed on
Feb 14, 2008
Sold by
Jackson Alphonso R
Bought by
Oris Rising
Current Estimated Value
Purchase Details
Closed on
Sep 5, 2006
Sold by
Countrywide Home Loans Inc
Bought by
Hud
Purchase Details
Closed on
Feb 24, 2006
Sold by
Szczesny Paul and Tenbrink Micdy
Bought by
Countrywide Home Loans Inc
Purchase Details
Closed on
Dec 12, 2001
Sold by
Tagarel Gregory J
Bought by
Szczesny Paul
Home Financials for this Owner
Home Financials are based on the most recent Mortgage that was taken out on this home.
Original Mortgage
$155,244
Interest Rate
7.03%
Mortgage Type
Purchase Money Mortgage
Create a Home Valuation Report for This Property
The Home Valuation Report is an in-depth analysis detailing your home's value as well as a comparison with similar homes in the area
Home Values in the Area
Average Home Value in this Area
Purchase History
| Date | Buyer | Sale Price | Title Company |
|---|---|---|---|
| Oris Rising | $116,365 | None Available | |
| Hud | -- | None Available | |
| Countrywide Home Loans Inc | $157,646 | None Available | |
| Szczesny Paul | $156,500 | -- |
Source: Public Records
Mortgage History
| Date | Status | Borrower | Loan Amount |
|---|---|---|---|
| Previous Owner | Szczesny Paul | $155,244 |
Source: Public Records
Tax History Compared to Growth
Tax History
| Year | Tax Paid | Tax Assessment Tax Assessment Total Assessment is a certain percentage of the fair market value that is determined by local assessors to be the total taxable value of land and additions on the property. | Land | Improvement |
|---|---|---|---|---|
| 2025 | $2,859 | $127,520 | $0 | $0 |
| 2024 | $2,778 | $120,420 | $0 | $0 |
| 2023 | $2,633 | $98,430 | $0 | $0 |
| 2022 | $2,544 | $88,590 | $0 | $0 |
| 2021 | $2,691 | $83,800 | $0 | $0 |
| 2020 | $2,496 | $77,710 | $0 | $0 |
| 2019 | $2,407 | $74,420 | $0 | $0 |
| 2018 | $69 | $70,040 | $0 | $0 |
| 2017 | $2,414 | $60,170 | $10,170 | $50,000 |
| 2016 | $2,411 | $60,170 | $0 | $0 |
| 2015 | -- | $55,020 | $0 | $0 |
| 2012 | -- | $43,480 | $0 | $0 |
Source: Public Records
Map
Nearby Homes
- 28130 Liberty Dr
- 28530 Ryan Rd
- 28570 Norwood Ave
- 4480 Bayberry Ct
- 28314 James Dr
- 29265 van Laan Dr
- 29269 Ryan Rd
- 3454 Winterfield Dr
- 29119 Orvylle Dr
- 27575 Strathmoor Dr
- 27365 Ryan Rd
- 29202 W Nottingham Cir
- 3922 Dwight Dr
- 28160 Universal Dr Unit J125
- 28264 Universal Dr Unit 82
- 28230 Universal Dr Unit F69
- 28556 Milton Ave
- 4460 Buckingham Dr
- 27226 Warner Ave
- 28000 Universal Dr Unit 1
- 3903 Robertson Dr
- 28426 Wexford Dr
- 28414 Wexford Dr
- 3915 Robertson Dr
- 28438 Wexford Dr
- 3852 Parent Ave
- 3904 Parent Ave
- 3916 Parent Ave
- 28450 Wexford Dr
- 3927 Robertson Dr
- 3902 Robertson Dr
- 3844 Robertson Dr
- 3914 Robertson Dr
- 3939 Robertson Dr
- 3926 Robertson Dr
- 28427 Wexford Dr
- 28415 Wexford Dr
- 3731 Robertson Dr
- 28439 Wexford Dr
- 28234 Wexford Dr