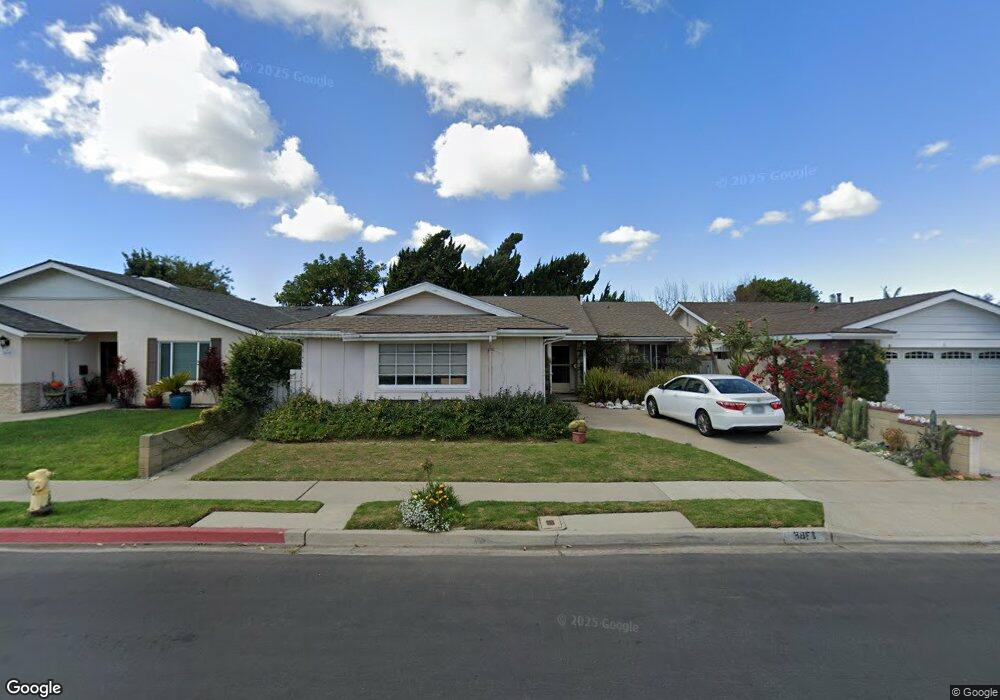
3851 Rose St Seal Beach, CA 90740
Estimated Value: $1,239,049 - $1,336,000
3
Beds
2
Baths
1,524
Sq Ft
$856/Sq Ft
Est. Value
About This Home
This home is located at 3851 Rose St, Seal Beach, CA 90740 and is currently estimated at $1,305,262, approximately $856 per square foot. 3851 Rose St is a home located in Orange County with nearby schools including Jack L. Weaver Elementary School, J. H. Mcgaugh Elementary School, and Sharon Christa Mcauliffe Middle School.
Ownership History
Date
Name
Owned For
Owner Type
Purchase Details
Closed on
Sep 4, 2003
Sold by
Bar Cohen Yoseph and Bar Cohen Yardena
Bought by
Bar Cohen Yoseph and Bar Cohen Yardena
Current Estimated Value
Home Financials for this Owner
Home Financials are based on the most recent Mortgage that was taken out on this home.
Original Mortgage
$106,500
Interest Rate
6.06%
Mortgage Type
Purchase Money Mortgage
Purchase Details
Closed on
Aug 8, 2002
Sold by
Bar Cohen Yoseph and Bar Cohen Yardena
Bought by
Bar Cohen Yoseph and Bar Cohen Yardena
Home Financials for this Owner
Home Financials are based on the most recent Mortgage that was taken out on this home.
Original Mortgage
$108,000
Interest Rate
6.51%
Create a Home Valuation Report for This Property
The Home Valuation Report is an in-depth analysis detailing your home's value as well as a comparison with similar homes in the area
Home Values in the Area
Average Home Value in this Area
Purchase History
| Date | Buyer | Sale Price | Title Company |
|---|---|---|---|
| Bar Cohen Yoseph | -- | -- | |
| Bar Cohen Yoseph | -- | Gateway Title Company | |
| Bar Cohen Yoseph | -- | -- | |
| Bar Cohen Yoseph | -- | Commerce Title Company |
Source: Public Records
Mortgage History
| Date | Status | Borrower | Loan Amount |
|---|---|---|---|
| Closed | Bar Cohen Yoseph | $106,500 | |
| Closed | Bar Cohen Yoseph | $108,000 |
Source: Public Records
Tax History Compared to Growth
Tax History
| Year | Tax Paid | Tax Assessment Tax Assessment Total Assessment is a certain percentage of the fair market value that is determined by local assessors to be the total taxable value of land and additions on the property. | Land | Improvement |
|---|---|---|---|---|
| 2025 | $3,977 | $307,653 | $174,788 | $132,865 |
| 2024 | $3,977 | $301,621 | $171,361 | $130,260 |
| 2023 | $3,881 | $295,707 | $168,001 | $127,706 |
| 2022 | $3,854 | $289,909 | $164,707 | $125,202 |
| 2021 | $3,769 | $284,225 | $161,477 | $122,748 |
| 2020 | $3,772 | $281,311 | $159,821 | $121,490 |
| 2019 | $3,642 | $275,796 | $156,688 | $119,108 |
| 2018 | $3,497 | $270,389 | $153,616 | $116,773 |
| 2017 | $3,423 | $265,088 | $150,604 | $114,484 |
| 2016 | $3,356 | $259,891 | $147,651 | $112,240 |
| 2015 | $3,315 | $255,988 | $145,433 | $110,555 |
| 2014 | $3,202 | $250,974 | $142,584 | $108,390 |
Source: Public Records
Map
Nearby Homes
- 4725 Elder Ave
- 4601 Guava Ave
- 4624 Ironwood Ave
- 4765 Ironwood Ave
- 5041 Lampson Ave
- 3831 Wisteria St
- 5021 Apollo Cir
- 3790 Goldenrod St
- 12441 Interior Cir
- 12741 Bartlett St
- 3520 Jasmin Cir
- 4341 Elder Ave
- 4260 Dogwood Ave
- 12671 Saint Mark St
- 12586 George Reyburn Rd
- 12581 George Reyburn Rd
- 5302 Clark Cir
- 5832 Ludlow Ave
- 11901 Saint Mark St
- 5902 Belgrave Ave