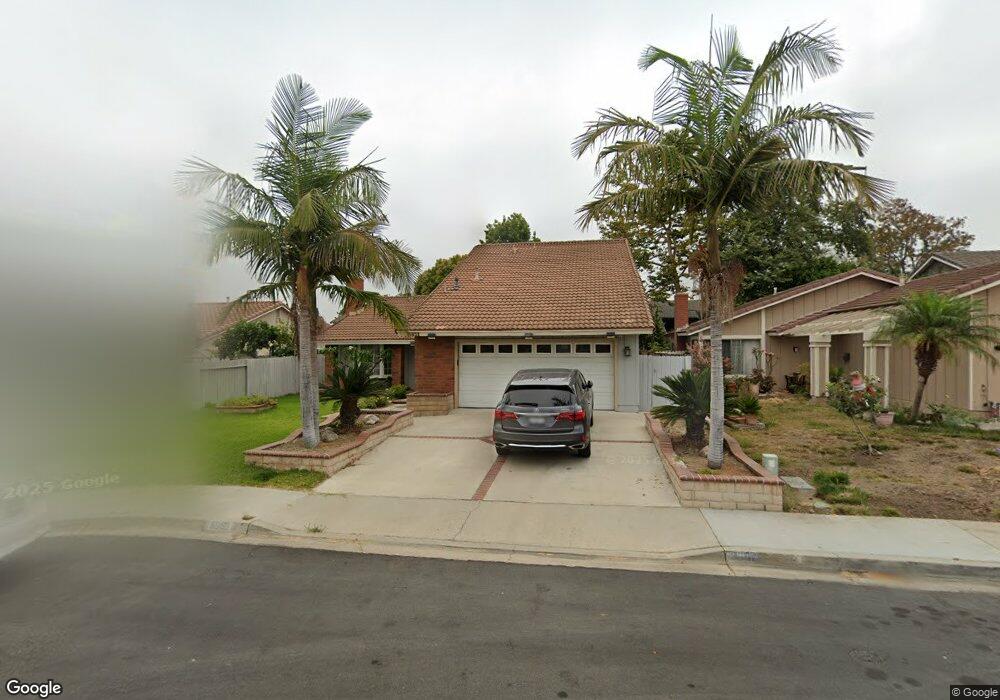
3851 Uris Ct Irvine, CA 92606
Walnut NeighborhoodEstimated Value: $1,417,000 - $1,781,000
4
Beds
3
Baths
1,929
Sq Ft
$834/Sq Ft
Est. Value
About This Home
This home is located at 3851 Uris Ct, Irvine, CA 92606 and is currently estimated at $1,608,147, approximately $833 per square foot. 3851 Uris Ct is a home located in Orange County with nearby schools including College Park Elementary School, Venado Middle School, and Irvine High School.
Ownership History
Date
Name
Owned For
Owner Type
Purchase Details
Closed on
Nov 17, 2011
Sold by
Hu Yingbo and Li Ping
Bought by
Hu Yingbo and Li Ping
Current Estimated Value
Home Financials for this Owner
Home Financials are based on the most recent Mortgage that was taken out on this home.
Original Mortgage
$253,000
Outstanding Balance
$25,698
Interest Rate
4.09%
Mortgage Type
New Conventional
Estimated Equity
$1,582,449
Purchase Details
Closed on
Feb 15, 2011
Sold by
Luu Toan Q
Bought by
Hu Yingbo and Li Ping
Home Financials for this Owner
Home Financials are based on the most recent Mortgage that was taken out on this home.
Original Mortgage
$275,000
Interest Rate
3.75%
Mortgage Type
New Conventional
Purchase Details
Closed on
Feb 22, 1999
Sold by
Toan Luu and Toan Q
Bought by
Luu Toan Q
Home Financials for this Owner
Home Financials are based on the most recent Mortgage that was taken out on this home.
Original Mortgage
$152,000
Interest Rate
6.78%
Create a Home Valuation Report for This Property
The Home Valuation Report is an in-depth analysis detailing your home's value as well as a comparison with similar homes in the area
Home Values in the Area
Average Home Value in this Area
Purchase History
| Date | Buyer | Sale Price | Title Company |
|---|---|---|---|
| Hu Yingbo | -- | Lsi Title Company | |
| Hu Yingbo | $605,000 | Lawyers Title | |
| Luu Toan Q | -- | Lawyers Title Company |
Source: Public Records
Mortgage History
| Date | Status | Borrower | Loan Amount |
|---|---|---|---|
| Open | Hu Yingbo | $253,000 | |
| Closed | Hu Yingbo | $275,000 | |
| Previous Owner | Luu Toan Q | $152,000 |
Source: Public Records
Tax History
| Year | Tax Paid | Tax Assessment Tax Assessment Total Assessment is a certain percentage of the fair market value that is determined by local assessors to be the total taxable value of land and additions on the property. | Land | Improvement |
|---|---|---|---|---|
| 2025 | $8,010 | $775,108 | $638,726 | $136,382 |
| 2024 | $8,010 | $759,910 | $626,202 | $133,708 |
| 2023 | $7,802 | $745,010 | $613,923 | $131,087 |
| 2022 | $7,653 | $730,402 | $601,885 | $128,517 |
| 2021 | $7,477 | $716,081 | $590,083 | $125,998 |
| 2020 | $7,435 | $708,739 | $584,032 | $124,707 |
| 2019 | $7,269 | $694,843 | $572,581 | $122,262 |
| 2018 | $7,140 | $681,219 | $561,354 | $119,865 |
| 2017 | $6,992 | $667,862 | $550,347 | $117,515 |
| 2016 | $6,680 | $654,767 | $539,556 | $115,211 |
| 2015 | $6,526 | $644,932 | $531,451 | $113,481 |
| 2014 | $6,398 | $632,299 | $521,040 | $111,259 |
Source: Public Records
Map
Nearby Homes
- 3761 Provincetown Ave
- 14272 Saarinen Ct
- 14232 Matisse Ave
- 14612 Beach Ave
- 14072 Picasso Ct
- 27 Ohio
- 3981 Cedron St
- 46 Nebraska
- 92 New Season Unit 70
- 4062 Escudero Dr
- 17 Rhode Island
- 13802 Margene Cir
- 155 Zephyr Run
- 10 Goldenbush Unit 36
- 32 Goldenbush
- 424 Deerfield Ave Unit 172
- 10 Poinsettia
- 3 Wintergreen Unit 7
- 280 Tustin Field Dr
- 4051 Salacia Dr
- 3861 Uris Ct
- 14392 Majorca Ave
- 14402 Majorca Ave
- 14382 Majorca Ave
- 14381 Miro Ct
- 14372 Majorca Ave
- 3871 Uris Ct
- 14361 Miro Ct
- 14391 Miro Ct
- 3881 Uris Ct
- 14362 Majorca Ave
- 3842 Uris Ct
- 14351 Miro Ct
- 3872 Uris Ct
- 3832 Uris Ct
- 3862 Uris Ct
- 14352 Majorca Ave
- 14401 Majorca Ave
- 3892 Capri Ave
- 14341 Miro Ct
Your Personal Tour Guide
Ask me questions while you tour the home.