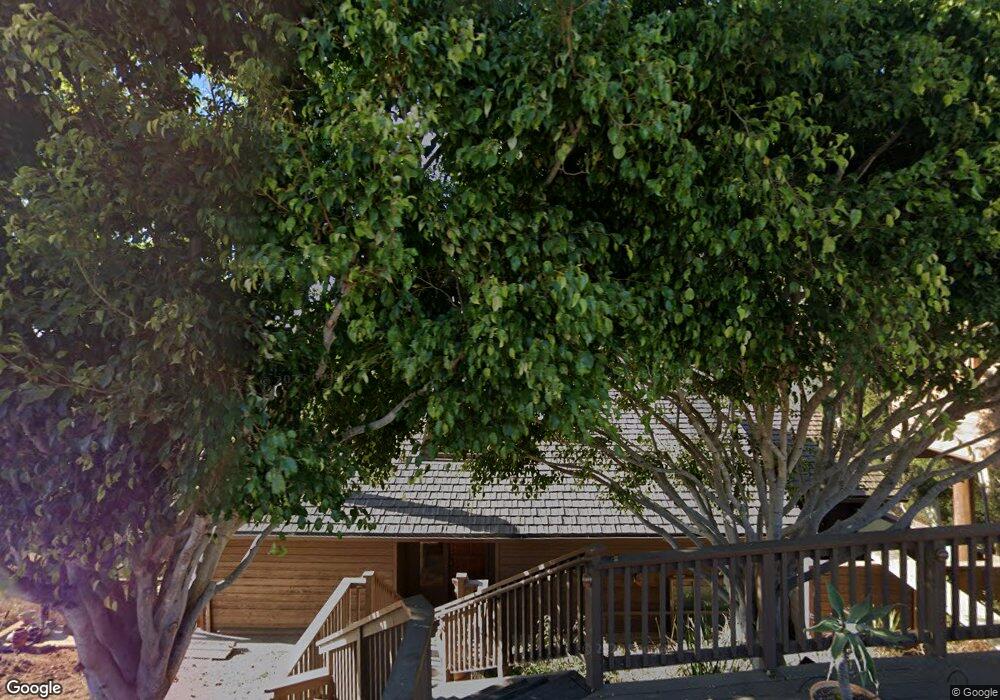
3852 Alameda Place San Diego, CA 92103
Mission Hills NeighborhoodEstimated Value: $2,277,297 - $2,573,000
3
Beds
3
Baths
2,375
Sq Ft
$1,027/Sq Ft
Est. Value
About This Home
This home is located at 3852 Alameda Place, San Diego, CA 92103 and is currently estimated at $2,438,324, approximately $1,026 per square foot. 3852 Alameda Place is a home located in San Diego County with nearby schools including Grant K-8, Richard Henry Dana Middle School, and Roosevelt International Middle School.
Ownership History
Date
Name
Owned For
Owner Type
Purchase Details
Closed on
Feb 10, 2016
Sold by
Davenport William and Davenport Beth
Bought by
William & Beth Davenport Revocable Trust
Current Estimated Value
Purchase Details
Closed on
Oct 26, 2009
Sold by
Busby H M
Bought by
Davenport William and Davenport Beth
Home Financials for this Owner
Home Financials are based on the most recent Mortgage that was taken out on this home.
Original Mortgage
$697,500
Outstanding Balance
$451,465
Interest Rate
4.83%
Mortgage Type
New Conventional
Estimated Equity
$1,986,859
Purchase Details
Closed on
Mar 31, 1997
Sold by
Mulligan Marsha L Trust 08-05-95
Bought by
Busby H M
Home Financials for this Owner
Home Financials are based on the most recent Mortgage that was taken out on this home.
Original Mortgage
$400,000
Interest Rate
7.86%
Purchase Details
Closed on
Sep 5, 1995
Sold by
Mulligan Marsha Lee
Bought by
Mulligan Marsha L
Create a Home Valuation Report for This Property
The Home Valuation Report is an in-depth analysis detailing your home's value as well as a comparison with similar homes in the area
Home Values in the Area
Average Home Value in this Area
Purchase History
| Date | Buyer | Sale Price | Title Company |
|---|---|---|---|
| William & Beth Davenport Revocable Trust | -- | None Available | |
| Davenport William | $1,125,000 | California Title Company | |
| Busby H M | $500,000 | First American Title Co | |
| Mulligan Marsha L | -- | -- | |
| Mulligan Marsha L | -- | -- |
Source: Public Records
Mortgage History
| Date | Status | Borrower | Loan Amount |
|---|---|---|---|
| Open | Davenport William | $697,500 | |
| Previous Owner | Busby H M | $400,000 |
Source: Public Records
Tax History Compared to Growth
Tax History
| Year | Tax Paid | Tax Assessment Tax Assessment Total Assessment is a certain percentage of the fair market value that is determined by local assessors to be the total taxable value of land and additions on the property. | Land | Improvement |
|---|---|---|---|---|
| 2025 | $17,481 | $1,452,164 | $1,032,655 | $419,509 |
| 2024 | $17,481 | $1,423,691 | $1,012,407 | $411,284 |
| 2023 | $17,094 | $1,395,776 | $992,556 | $403,220 |
| 2022 | $16,636 | $1,368,409 | $973,095 | $395,314 |
| 2021 | $16,519 | $1,341,578 | $954,015 | $387,563 |
| 2020 | $16,318 | $1,327,823 | $944,233 | $383,590 |
| 2019 | $16,021 | $1,301,788 | $925,719 | $376,069 |
| 2018 | $14,948 | $1,276,264 | $907,568 | $368,696 |
| 2017 | $80 | $1,251,240 | $889,773 | $361,467 |
| 2016 | $14,441 | $1,226,707 | $872,327 | $354,380 |
| 2015 | $14,228 | $1,208,281 | $859,224 | $349,057 |
| 2014 | $14,003 | $1,184,613 | $842,393 | $342,220 |
Source: Public Records
Map
Nearby Homes
- 2045 W California St
- 2111 W California St
- 3903 California St Unit 3
- 3975 Hortensia St Unit E1
- 3975 Hortensia St Unit E7
- 4232 Arden Way
- 3961 Hortensia St Unit H4
- 1864 Sunset Blvd
- 1806 Mckee St Unit A2
- 1806 Mckee St Unit A9
- 3770 Keating St
- 2290 Congress St
- 3625 Keating St Unit 4
- 1860 W Montecito Way
- 1753 W Lewis St
- 2120 Pine St
- 3519 Andrews St
- 1694 Torrance St
- 2147 Pine St
- 1695 Neale St
- 3855 Alameda Place
- 3876 Alameda Place
- 1986 Linwood St
- 1995 Guy St
- 1991 Linwood St
- 1980 Linwood St
- 1981 Linwood St
- 3906 Alameda Place
- 1970 Linwood St
- 1975 Guy St
- 1994 Titus St
- 3903 Alameda Place
- 4003 Bandini St
- 1969 Linwood St
- 3965 Bandini St
- 3977 Bandini St
- 1990 Titus St
- 3912 Alameda Place
- 3915 Alameda Place
- 1984 Guy St