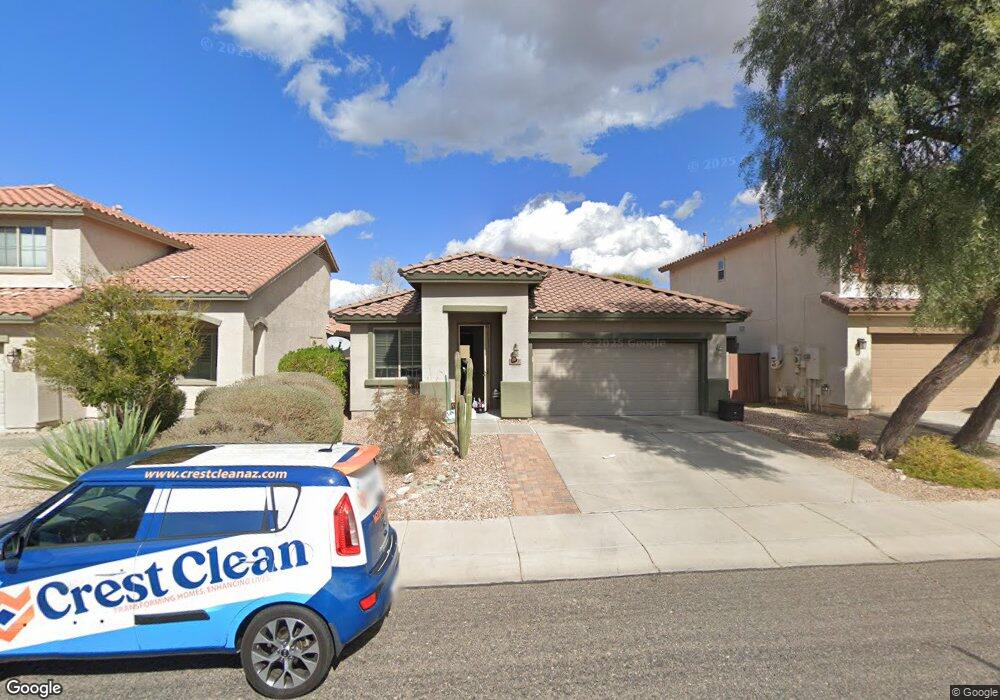
3852 W Links Dr Phoenix, AZ 85086
Estimated Value: $462,703 - $494,000
--
Bed
2
Baths
1,827
Sq Ft
$263/Sq Ft
Est. Value
About This Home
This home is located at 3852 W Links Dr, Phoenix, AZ 85086 and is currently estimated at $480,926, approximately $263 per square foot. 3852 W Links Dr is a home located in Maricopa County with nearby schools including Canyon Springs STEM Academy, Boulder Creek High School, and Great Hearts Academies - Anthem Prep.
Ownership History
Date
Name
Owned For
Owner Type
Purchase Details
Closed on
Nov 8, 2006
Sold by
Cohen Darren J and Cohen Amy M
Bought by
Cohen Darren J and Darren J Cohen Living Trust
Current Estimated Value
Purchase Details
Closed on
Nov 1, 2005
Sold by
Anthem Arizona Llc
Bought by
Del Webbs Coventry Homes Inc
Home Financials for this Owner
Home Financials are based on the most recent Mortgage that was taken out on this home.
Original Mortgage
$249,628
Outstanding Balance
$133,444
Interest Rate
5.74%
Mortgage Type
New Conventional
Estimated Equity
$347,482
Purchase Details
Closed on
Oct 1, 2005
Sold by
Del Webbs Coventry Homes Inc
Bought by
Cohen Darren J and Cohen Amy M
Home Financials for this Owner
Home Financials are based on the most recent Mortgage that was taken out on this home.
Original Mortgage
$249,628
Outstanding Balance
$133,444
Interest Rate
5.74%
Mortgage Type
New Conventional
Estimated Equity
$347,482
Create a Home Valuation Report for This Property
The Home Valuation Report is an in-depth analysis detailing your home's value as well as a comparison with similar homes in the area
Home Values in the Area
Average Home Value in this Area
Purchase History
| Date | Buyer | Sale Price | Title Company |
|---|---|---|---|
| Cohen Darren J | -- | None Available | |
| Del Webbs Coventry Homes Inc | -- | Sun Title Agency Co | |
| Cohen Darren J | $282,351 | Sun Title Agency Co |
Source: Public Records
Mortgage History
| Date | Status | Borrower | Loan Amount |
|---|---|---|---|
| Open | Cohen Darren J | $249,628 | |
| Closed | Cohen Darren J | $46,805 |
Source: Public Records
Tax History Compared to Growth
Tax History
| Year | Tax Paid | Tax Assessment Tax Assessment Total Assessment is a certain percentage of the fair market value that is determined by local assessors to be the total taxable value of land and additions on the property. | Land | Improvement |
|---|---|---|---|---|
| 2025 | $2,676 | $24,834 | -- | -- |
| 2024 | $2,508 | $23,652 | -- | -- |
| 2023 | $2,508 | $38,080 | $7,610 | $30,470 |
| 2022 | $1,929 | $27,470 | $5,490 | $21,980 |
| 2021 | $1,971 | $25,330 | $5,060 | $20,270 |
| 2020 | $1,912 | $23,780 | $4,750 | $19,030 |
| 2019 | $1,862 | $22,050 | $4,410 | $17,640 |
| 2018 | $1,787 | $20,910 | $4,180 | $16,730 |
| 2017 | $1,735 | $19,270 | $3,850 | $15,420 |
| 2016 | $1,542 | $18,580 | $3,710 | $14,870 |
| 2015 | $1,414 | $17,360 | $3,470 | $13,890 |
Source: Public Records
Map
Nearby Homes
- 42920 N Raleigh Ct Unit 20A
- 42905 N Ericson Ct Unit 20A
- 3824 W Rushmore Dr Unit 20A
- 3748 W Rushmore Dr
- 43103 N Vista Hills Dr
- 3629 W Magellan Dr
- 42424 N Gavilan Peak Pkwy Unit 63212
- 42424 N Gavilan Peak Pkwy Unit 14104
- 42424 N Gavilan Peak Pkwy Unit 33104
- 42424 N Gavilan Peak Pkwy Unit 55206
- 42424 N Gavilan Peak Pkwy Unit 7206
- 42424 N Gavilan Peak Pkwy Unit 4104
- 42424 N Gavilan Peak Pkwy Unit 59212
- 42424 N Gavilan Peak Pkwy Unit 19102
- 42424 N Gavilan Peak Pkwy Unit 57104
- 42424 N Gavilan Peak Pkwy Unit 42206
- 43336 N Heavenly Way Unit 57
- 43416 N Hudson Trail
- 3718 W Bingham Dr
- 42723 N 43rd Dr
- 3848 W Links Dr
- 3860 W Links Dr
- 3844 W Links Dr
- 3853 W Ashton Dr
- 3849 W Ashton Dr Unit 59
- 3864 W Links Dr
- 3840 W Links Dr
- 3857 W Ashton Dr
- 3861 W Ashton Dr
- 3841 W Ashton Dr
- 3868 W Links Dr
- 3836 W Links Dr
- 3865 W Ashton Dr Unit 59
- 3837 W Ashton Dr
- 3872 W Links Dr
- 3832 W Links Dr Unit 59
- 3869 W Ashton Dr
- 3833 W Ashton Dr
- 3873 W Ashton Dr
- 3876 W Links Dr