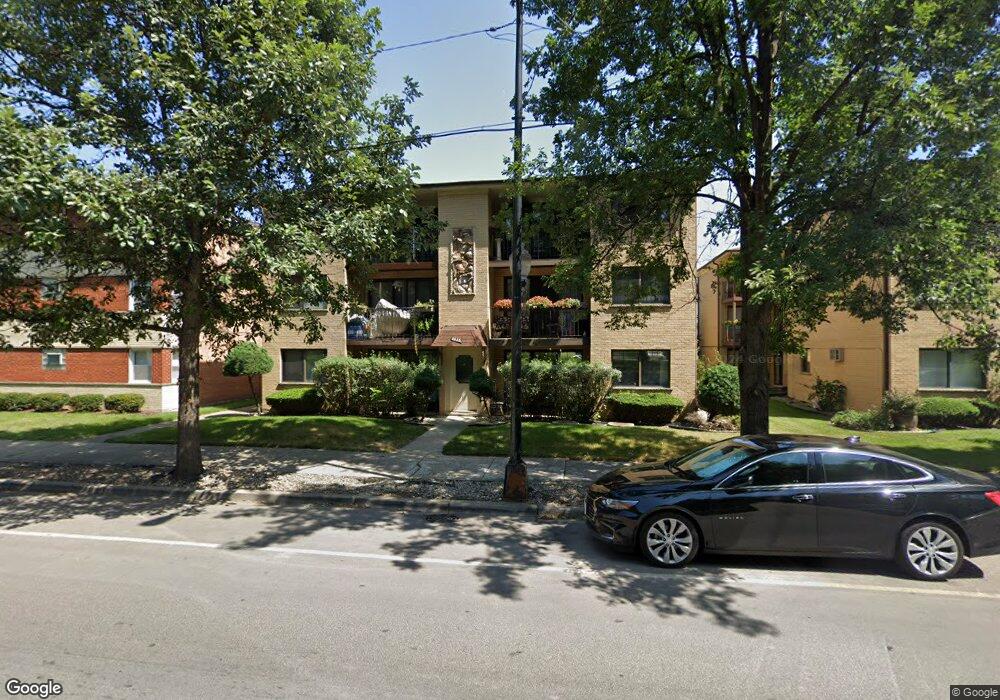
3853 N Narragansett Ave Unit 30 Chicago, IL 60634
Portage Park NeighborhoodEstimated Value: $218,000 - $225,000
2
Beds
1
Bath
9,975
Sq Ft
$22/Sq Ft
Est. Value
About This Home
This home is located at 3853 N Narragansett Ave Unit 30, Chicago, IL 60634 and is currently estimated at $222,338, approximately $22 per square foot. 3853 N Narragansett Ave Unit 30 is a home located in Cook County with nearby schools including Smyser Elementary School, Schurz High School, and Pope Francis Global Academy.
Ownership History
Date
Name
Owned For
Owner Type
Purchase Details
Closed on
Sep 6, 2024
Sold by
Hirtopeanu Virgil and Pogacean Mihaela
Bought by
Moore Dejuan
Current Estimated Value
Home Financials for this Owner
Home Financials are based on the most recent Mortgage that was taken out on this home.
Original Mortgage
$196,650
Outstanding Balance
$194,293
Interest Rate
6.13%
Mortgage Type
New Conventional
Estimated Equity
$28,045
Purchase Details
Closed on
Aug 19, 2005
Sold by
Gerich Eva Anna and Eva Anna Gerich Trust
Bought by
Hirtopeanu Virgil and Pogacean Mihaela
Home Financials for this Owner
Home Financials are based on the most recent Mortgage that was taken out on this home.
Original Mortgage
$151,920
Interest Rate
6.62%
Mortgage Type
New Conventional
Purchase Details
Closed on
Nov 16, 2001
Sold by
Gerich Eva Anna
Bought by
Gerich Eva Anna and The Eva Anna Gerich Trust
Create a Home Valuation Report for This Property
The Home Valuation Report is an in-depth analysis detailing your home's value as well as a comparison with similar homes in the area
Home Values in the Area
Average Home Value in this Area
Purchase History
| Date | Buyer | Sale Price | Title Company |
|---|---|---|---|
| Moore Dejuan | $207,000 | Truly Title | |
| Hirtopeanu Virgil | -- | Premier Title | |
| Gerich Eva Anna | -- | -- |
Source: Public Records
Mortgage History
| Date | Status | Borrower | Loan Amount |
|---|---|---|---|
| Open | Moore Dejuan | $196,650 | |
| Previous Owner | Hirtopeanu Virgil | $151,920 |
Source: Public Records
Tax History Compared to Growth
Tax History
| Year | Tax Paid | Tax Assessment Tax Assessment Total Assessment is a certain percentage of the fair market value that is determined by local assessors to be the total taxable value of land and additions on the property. | Land | Improvement |
|---|---|---|---|---|
| 2024 | $1,410 | $14,321 | $3,424 | $10,897 |
| 2023 | $1,353 | $10,001 | $2,740 | $7,261 |
| 2022 | $1,353 | $10,001 | $2,740 | $7,261 |
| 2021 | $1,341 | $9,999 | $2,739 | $7,260 |
| 2020 | $1,689 | $10,685 | $1,223 | $9,462 |
| 2019 | $1,715 | $11,964 | $1,223 | $10,741 |
| 2018 | $1,685 | $11,964 | $1,223 | $10,741 |
| 2017 | $1,440 | $10,063 | $1,076 | $8,987 |
| 2016 | $1,515 | $10,063 | $1,076 | $8,987 |
| 2015 | $1,363 | $10,063 | $1,076 | $8,987 |
| 2014 | $1,960 | $13,132 | $1,027 | $12,105 |
| 2013 | $1,910 | $13,132 | $1,027 | $12,105 |
Source: Public Records
Map
Nearby Homes
- 3843 N Narragansett Ave Unit 201
- 6326 W Berenice Ave
- 6243 W Byron St
- 3946 N Merrimac Ave
- 4103 N Narragansett Ave
- 6455 W Belle Plaine Ave Unit 208
- 4106 N Mobile Ave
- 6540 W Irving Park Rd Unit 603
- 4052 N Melvina Ave
- 6109 W Berenice Ave
- 4039 N Melvina Ave
- 6357 W Addison St Unit GSE
- 4141 N Narragansett Ave Unit 8
- 3544 N Nagle Ave
- 3507 N Narragansett Ave
- 6248 W Berteau Ave
- 6308 W Cornelia Ave
- 6730 W Berenice Ave
- 3459 N Narragansett Ave
- 3920 N Austin Ave
- 3853 N Narragansett Ave Unit 30
- 3853 N Narragansett Ave Unit 10
- 3853 N Narragansett Ave Unit 10
- 3853 N Narragansett Ave Unit 30
- 3853 N Narragansett Ave Unit 20
- 3853 N Narragansett Ave Unit 20
- 3853 N Narragansett Ave Unit 20
- 3853 N Narragansett Ave Unit 301
- 3853 N Narragansett Ave Unit 101
- 3853 N Narragansett Ave Unit 202
- 3853 N Narragansett Ave Unit 303
- 3857 N Narragansett Ave
- 3843 N Narragansett Ave Unit 20
- 3843 N Narragansett Ave Unit 30
- 3843 N Narragansett Ave Unit 30
- 3843 N Narragansett Ave Unit 10
- 3843 N Narragansett Ave Unit 30
- 3843 N Narragansett Ave Unit 20
- 3843 N Narragansett Ave Unit 10