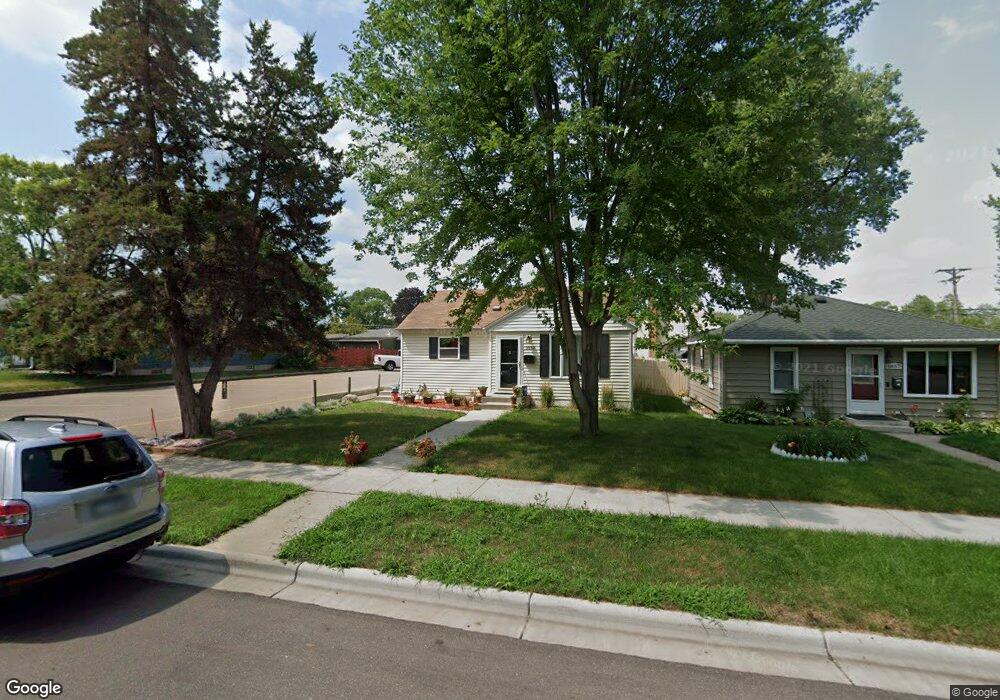
3853 Scott Ave N Robbinsdale, MN 55422
Estimated Value: $255,000 - $288,000
2
Beds
1
Bath
754
Sq Ft
$350/Sq Ft
Est. Value
About This Home
This home is located at 3853 Scott Ave N, Robbinsdale, MN 55422 and is currently estimated at $263,998, approximately $350 per square foot. 3853 Scott Ave N is a home located in Hennepin County with nearby schools including Lakeview Elementary School, Robbinsdale Middle School, and Robbinsdale Cooper Senior High School.
Ownership History
Date
Name
Owned For
Owner Type
Purchase Details
Closed on
May 28, 2019
Sold by
Amato Alicia Gerloma and Amato Alica Gerloma
Bought by
Amato Alicia Gerloma
Current Estimated Value
Home Financials for this Owner
Home Financials are based on the most recent Mortgage that was taken out on this home.
Original Mortgage
$165,750
Outstanding Balance
$145,735
Interest Rate
4.1%
Mortgage Type
New Conventional
Estimated Equity
$118,263
Purchase Details
Closed on
Oct 30, 2007
Sold by
Evs Concepts Llc
Bought by
Hesse Michael R and Amato Alicia G
Purchase Details
Closed on
Jul 20, 2007
Sold by
Us Bank
Bought by
Evs Concepts Llc
Purchase Details
Closed on
May 29, 1998
Sold by
Lyles Joyce K and Lyles Wayne
Bought by
Johnson Mark A
Purchase Details
Closed on
Oct 1, 1997
Sold by
Calvary Independent Baptist Church
Bought by
Lyles Joyce K and Lyles Wayne
Purchase Details
Closed on
Sep 27, 1997
Sold by
Calvary United Church
Bought by
Calvary Independent Baptist Church
Create a Home Valuation Report for This Property
The Home Valuation Report is an in-depth analysis detailing your home's value as well as a comparison with similar homes in the area
Home Values in the Area
Average Home Value in this Area
Purchase History
| Date | Buyer | Sale Price | Title Company |
|---|---|---|---|
| Amato Alicia Gerloma | $500 | Pillar Title Services | |
| Hesse Michael R | $175,000 | -- | |
| Evs Concepts Llc | $122,500 | -- | |
| Johnson Mark A | $74,900 | -- | |
| Lyles Joyce K | $55,000 | -- | |
| Calvary Independent Baptist Church | $450,000 | -- |
Source: Public Records
Mortgage History
| Date | Status | Borrower | Loan Amount |
|---|---|---|---|
| Open | Amato Alicia Gerloma | $165,750 |
Source: Public Records
Tax History Compared to Growth
Tax History
| Year | Tax Paid | Tax Assessment Tax Assessment Total Assessment is a certain percentage of the fair market value that is determined by local assessors to be the total taxable value of land and additions on the property. | Land | Improvement |
|---|---|---|---|---|
| 2024 | $3,527 | $223,200 | $91,400 | $131,800 |
| 2023 | $3,513 | $229,900 | $96,600 | $133,300 |
| 2022 | $3,237 | $242,000 | $111,000 | $131,000 |
| 2021 | $2,840 | $201,000 | $104,000 | $97,000 |
| 2020 | $2,791 | $173,000 | $83,000 | $90,000 |
| 2019 | $2,377 | $170,000 | $82,000 | $88,000 |
| 2018 | $1,570 | $137,000 | $67,000 | $70,000 |
| 2017 | $1,501 | $116,000 | $51,000 | $65,000 |
| 2016 | $1,326 | $101,000 | $53,000 | $48,000 |
| 2015 | $1,314 | $101,000 | $53,000 | $48,000 |
| 2014 | -- | $95,000 | $49,000 | $46,000 |
Source: Public Records
Map
Nearby Homes
- 3755 Regent Ave N
- 3728 Regent Ave N
- 5209 Scott Ln
- 3721 Quail Ave N
- 3918 Xenia Ave N
- 4107 Regent Ave N
- 3816 Orchard Ave N
- 4058 Vera Cruz Ave N
- 4108 Regent Ave N
- 3708 Xenia Ave N
- 3647 Orchard Ave N
- 3634 Orchard Ave N
- 3715 Yates Ave N
- 3833 Zane Ave N
- 4053 Yates Ave N
- 5808 36th Ave N
- 3964 Hubbard Ave N
- 4234 Welcome Ave N
- 5225 35th Ave N
- 4245 Welcome Ave N
- 3857 Scott Ave N
- 3845 Scott Ave N
- 3841 Scott Ave N
- 3905 Scott Ave N
- 3839 Scott Ave N
- 3856 Toledo Ave N
- 3850 Toledo Ave N
- 3856R Scott Ave N
- 3837 Scott Ave N
- 3848 Scott Ave N
- 3856 Scott Ave N
- 3840 Toledo Ave N
- 3909 Scott Ave N
- 3844 Scott Ave N
- 3836 Toledo Ave N
- 3829 Scott Ave N
- 3838 Scott Ave N
- 3902 Scott Ave N
- 3915 Scott Ave N
- 3832 Toledo Ave N