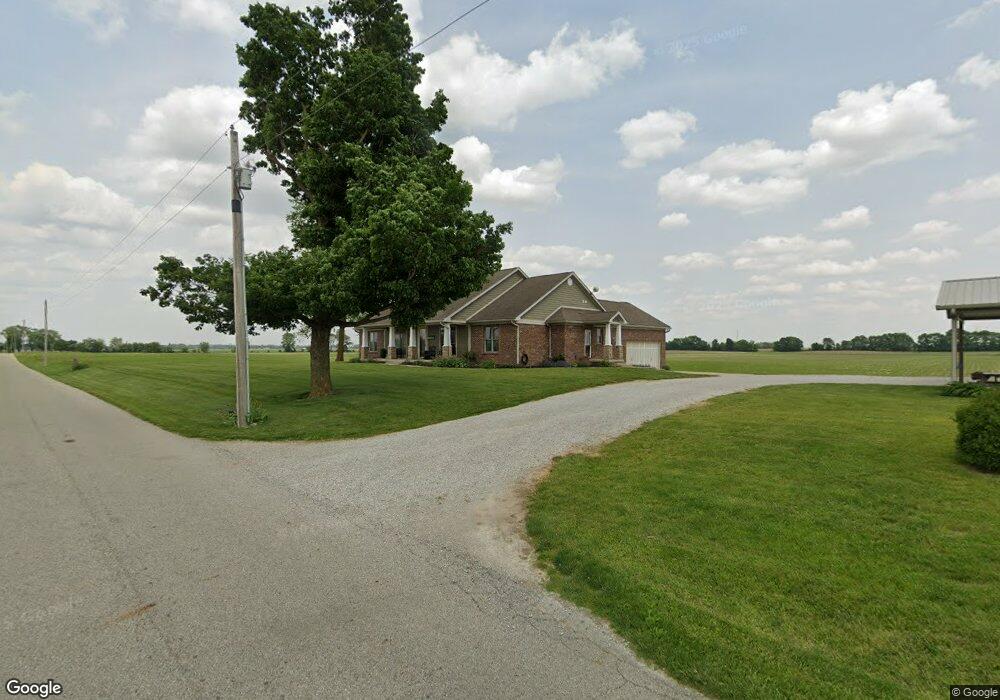
3854 S Sugar Creek Rd Franklin, IN 46131
Estimated Value: $370,000 - $566,468
4
Beds
2
Baths
2,845
Sq Ft
$157/Sq Ft
Est. Value
About This Home
This home is located at 3854 S Sugar Creek Rd, Franklin, IN 46131 and is currently estimated at $447,617, approximately $157 per square foot. 3854 S Sugar Creek Rd is a home located in Shelby County with nearby schools including Southwestern Elementary School and Southwestern High School.
Ownership History
Date
Name
Owned For
Owner Type
Purchase Details
Closed on
Jan 15, 2024
Sold by
Tennell Michael Scott
Bought by
Michael Scott Tennell Revocable Trust
Current Estimated Value
Purchase Details
Closed on
Jul 14, 2010
Sold by
Tennell Courtney B
Bought by
Tennell Michael Scott
Purchase Details
Closed on
May 15, 2009
Sold by
Tennell Michael Scott
Bought by
Tennell Michael Scott and Tennell Courtney B
Home Financials for this Owner
Home Financials are based on the most recent Mortgage that was taken out on this home.
Original Mortgage
$285,000
Interest Rate
4.85%
Mortgage Type
Future Advance Clause Open End Mortgage
Create a Home Valuation Report for This Property
The Home Valuation Report is an in-depth analysis detailing your home's value as well as a comparison with similar homes in the area
Home Values in the Area
Average Home Value in this Area
Purchase History
| Date | Buyer | Sale Price | Title Company |
|---|---|---|---|
| Michael Scott Tennell Revocable Trust | -- | None Listed On Document | |
| Tennell Michael Scott | -- | -- | |
| Tennell Michael Scott | -- | -- |
Source: Public Records
Mortgage History
| Date | Status | Borrower | Loan Amount |
|---|---|---|---|
| Previous Owner | Tennell Michael Scott | $285,000 |
Source: Public Records
Tax History Compared to Growth
Tax History
| Year | Tax Paid | Tax Assessment Tax Assessment Total Assessment is a certain percentage of the fair market value that is determined by local assessors to be the total taxable value of land and additions on the property. | Land | Improvement |
|---|---|---|---|---|
| 2024 | $3,053 | $463,100 | $21,200 | $441,900 |
| 2023 | $2,844 | $454,100 | $21,200 | $432,900 |
| 2022 | $3,155 | $443,900 | $21,200 | $422,700 |
| 2021 | $3,036 | $410,300 | $21,200 | $389,100 |
| 2020 | $2,941 | $399,200 | $21,200 | $378,000 |
| 2019 | $2,756 | $395,300 | $21,200 | $374,100 |
| 2018 | $2,380 | $364,100 | $20,500 | $343,600 |
| 2017 | $2,262 | $345,800 | $20,500 | $325,300 |
| 2016 | $2,234 | $339,900 | $20,500 | $319,400 |
| 2014 | $2,015 | $336,500 | $20,500 | $316,000 |
| 2013 | $2,015 | $312,400 | $19,800 | $292,600 |
Source: Public Records
Map
Nearby Homes
- W S 900 W
- 7214 E 100 N
- 1980 S 550 E
- 6000 S Marietta Rd
- 5519 W State Road 44
- 150 E South St
- 863 S 450 E
- 2136 Jennifer Ct
- 2117 Jennifer Ct
- 1990 Red Oak Dr
- 1175 S Old Us Highway 31
- 2310 Fox Dr
- 2073 S Us Highway 31
- 5531 E 300 N
- 2580 Stonybrook Ln
- 1532 Williamsburg Ln
- 1083 Beechtree Ln
- 1185 Beechtree Ln
- 1682 Millpond Ln
- 1669 Millpond Ln
- 3970 S Sugar Creek Rd
- 4052 S Sugar Creek Rd
- 3596 S Sugar Creek Rd
- 3518 S Sugar Creek Rd
- 4310 S Sugar Creek Rd
- 8157 W Shelby 350 S
- 3327 S Sugar Creek Rd
- 4483 S Sugar Creek Rd
- 8053 W Shelby 350 S
- 3224 S Sugar Creek Rd
- 3312 S Sugar Creek Rd
- 4587 S Sugar Creek Rd
- 7544 W 350 S
- 7735 W Shelby 350 S
- 7777 W Shelby 350 S
- 7737 W Shelby 350 S
- 2964 S Sugar Creek Rd
- 7559 E 100 S