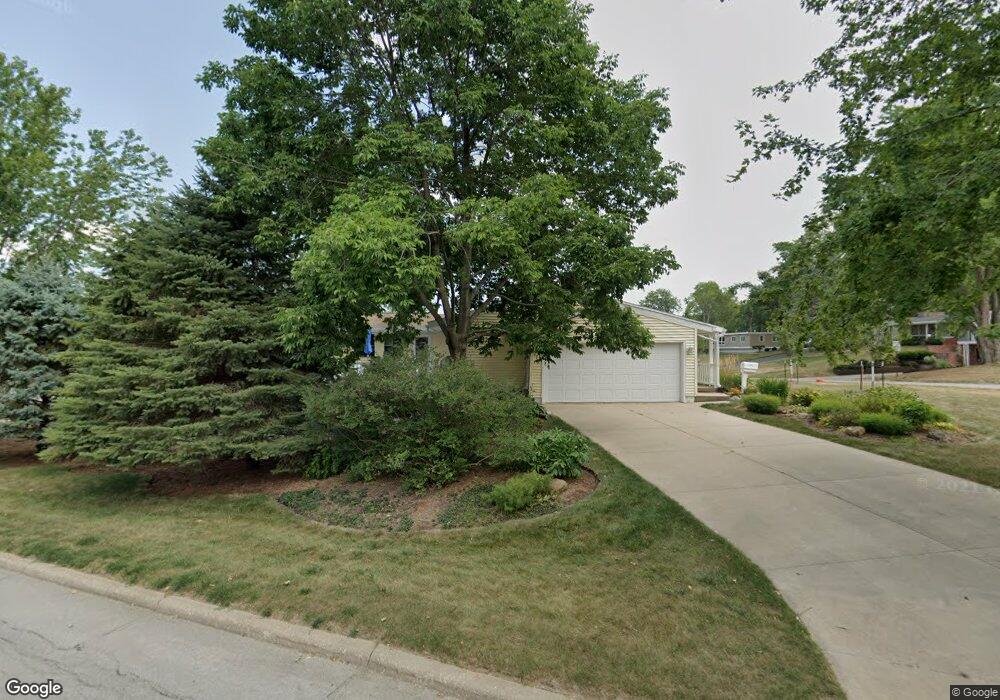
3854 Trailridge Rd SE Cedar Rapids, IA 52403
Estimated Value: $250,000 - $274,889
4
Beds
3
Baths
1,494
Sq Ft
$177/Sq Ft
Est. Value
About This Home
This home is located at 3854 Trailridge Rd SE, Cedar Rapids, IA 52403 and is currently estimated at $264,722, approximately $177 per square foot. 3854 Trailridge Rd SE is a home located in Linn County with nearby schools including Erskine Elementary School, McKinley STEAM Academy, and George Washington High School.
Ownership History
Date
Name
Owned For
Owner Type
Purchase Details
Closed on
Feb 15, 2021
Sold by
Winkler Angola and Brunow Angela
Bought by
Brunow Angola and Brunow Bryan T
Current Estimated Value
Purchase Details
Closed on
Feb 12, 2021
Sold by
Brunow Angela and Brunow Bryan T
Bought by
Brunow Angela and Brunow Bryan T
Purchase Details
Closed on
Jun 2, 2007
Sold by
Hanawalt Marlous Jean
Bought by
Winkler Angela
Home Financials for this Owner
Home Financials are based on the most recent Mortgage that was taken out on this home.
Original Mortgage
$118,000
Interest Rate
6.2%
Mortgage Type
Purchase Money Mortgage
Purchase Details
Closed on
Jun 30, 2006
Sold by
Wickham Louise V and Wickham Peter P
Bought by
Hanawalt Marlous Jean
Home Financials for this Owner
Home Financials are based on the most recent Mortgage that was taken out on this home.
Original Mortgage
$150,000
Interest Rate
6.72%
Mortgage Type
Unknown
Create a Home Valuation Report for This Property
The Home Valuation Report is an in-depth analysis detailing your home's value as well as a comparison with similar homes in the area
Purchase History
| Date | Buyer | Sale Price | Title Company |
|---|---|---|---|
| Brunow Angola | -- | None Listed On Document | |
| Brunow Angela | -- | None Available | |
| Winkler Angela | $147,000 | None Available | |
| Hanawalt Marlous Jean | $144,500 | None Available |
Source: Public Records
Mortgage History
| Date | Status | Borrower | Loan Amount |
|---|---|---|---|
| Previous Owner | Winkler Angela | $118,000 | |
| Previous Owner | Hanawalt Marlous Jean | $150,000 |
Source: Public Records
Tax History
| Year | Tax Paid | Tax Assessment Tax Assessment Total Assessment is a certain percentage of the fair market value that is determined by local assessors to be the total taxable value of land and additions on the property. | Land | Improvement |
|---|---|---|---|---|
| 2025 | $4,570 | $283,100 | $53,900 | $229,200 |
| 2024 | $4,742 | $281,400 | $53,900 | $227,500 |
| 2023 | $4,742 | $268,700 | $53,900 | $214,800 |
| 2022 | $4,132 | $233,700 | $42,200 | $191,500 |
| 2021 | $4,412 | $208,400 | $42,200 | $166,200 |
| 2020 | $4,412 | $208,600 | $37,500 | $171,100 |
| 2019 | $3,690 | $179,700 | $37,500 | $142,200 |
| 2018 | $3,584 | $179,700 | $37,500 | $142,200 |
| 2017 | $3,393 | $172,100 | $37,500 | $134,600 |
| 2016 | $3,393 | $159,600 | $37,500 | $122,100 |
| 2015 | $3,499 | $164,474 | $37,482 | $126,992 |
| 2014 | $3,314 | $164,875 | $37,482 | $127,393 |
| 2013 | $3,248 | $164,875 | $37,482 | $127,393 |
Source: Public Records
Map
Nearby Homes
- 3618 Kegler Ct SE
- 2403 Kestrel Dr SE
- 2226 Kestrel Dr SE
- 3112 Peregrine Ct SE
- 2306 Kestrel Dr SE
- 2420 Kestrel Dr SE
- 2409 Kestrel Dr SE
- 2421 Kestrel Dr SE
- 2221 Kestrel Dr SE
- 2319 Kestrel Dr SE
- 2415 Kestrel Dr SE
- 2325 Kestrel Dr SE
- 2313 Kestrel Dr SE
- 2307 Kestrel Dr SE
- 2312 Kestrel Dr SE
- 2427 Kestrel Dr SE
- 2416 Kestrel Dr SE
- 3100 Peregrine Ct SE
- 2215 Kestrel Dr SE
- 2300 Kestrel Dr SE
- 3856 Trailridge Rd SE
- 301 Trailridge Rd SE
- 3858 Trailridge Rd SE
- 304 Indiandale Rd SE
- 3831 Tomahawk Trail SE
- 3857 Trailridge Rd SE
- 3855 Trailridge Rd SE
- 3821 Tomahawk Trail SE
- 3847 Tomahawk Trail SE
- 3860 Trailridge Rd SE
- 305 Trailridge Rd SE
- 3863 Trailridge Rd SE
- 3851 Tomahawk Trail SE
- 3817 Tomahawk Trail SE
- 3859 Trailridge Rd SE
- 3862 Trailridge Rd SE
- 324 Indiandale Rd SE
- 317 Indiandale Rd SE
- 3855 Tomahawk Trail SE
- 3830 Tomahawk Trail SE
Your Personal Tour Guide
Ask me questions while you tour the home.