38541 Nasturtium Way Palm Desert, CA 92211
Palm Valley NeighborhoodEstimated payment $3,480/month
Highlights
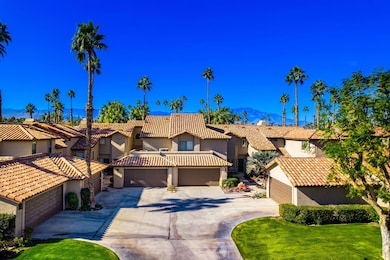
- On Golf Course
- Fitness Center
- Gated Community
- Palm Desert High School Rated A
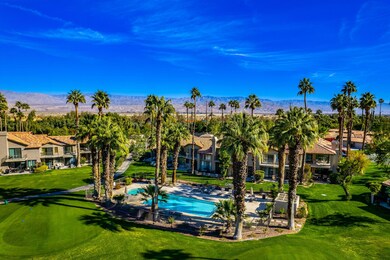
- Heated In Ground Pool
- Clubhouse
About This Home
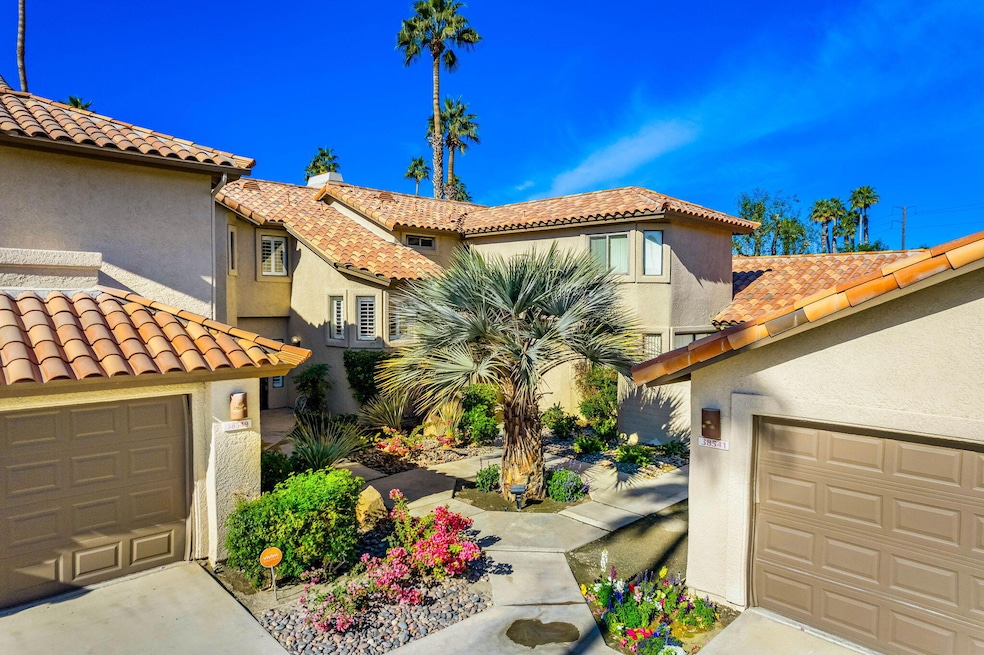
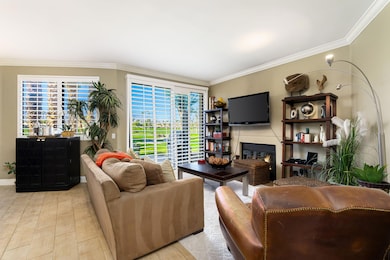
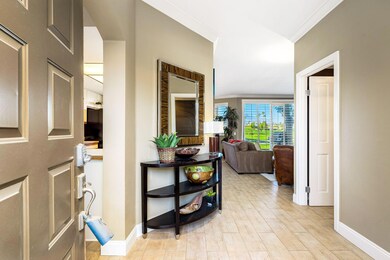
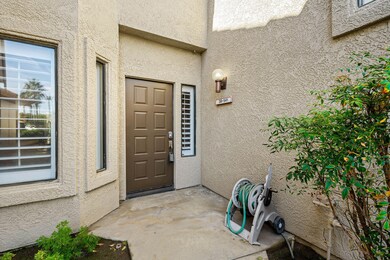
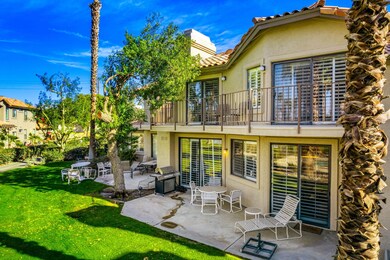
Rarely available Vista floor plan in the Palm Valley Country Club in Palm Desert. This stunning two-story townhome boasts 2 spacious bedrooms and 2.5 elegant baths. Highlights include new carpet, fresh paint, tasteful baseboards / crown molding, and complimentary furnishings. Step outside to your inviting patio, perfect for outdoor relaxation and entertainment, or enjoy the convenience of being just steps away from the pool area. Ideal as a primary residence, weekend retreat, or rental opportunity, this home is located just minutes from the shops, restaurants, and bars of El Paseo - The Rodeo Drive of the Coachella Valley. Don't miss out on making this exceptional property yours!
Property Details
Home Type
- Condominium
Year Built
- Built in 1989
Lot Details
- On Golf Course
- South Facing Home
- Sprinkler System
HOA Fees
Property Views
- Golf Course
- Mountain
Home Design
- Traditional Architecture
- Slab Foundation
- Tile Roof
- Stucco Exterior
Interior Spaces
- 1,515 Sq Ft Home
- 2-Story Property
- Furnished
- Fireplace
- Shutters
- Sliding Doors
- Great Room
- Dining Area
Kitchen
- Breakfast Room
- Breakfast Bar
- Gas Cooktop
- Recirculated Exhaust Fan
- Microwave
- Ice Maker
- Dishwasher
- Corian Countertops
- Tile Countertops
- Disposal
Flooring
- Carpet
- Tile
Bedrooms and Bathrooms
- 2 Bedrooms
- All Upper Level Bedrooms
- Secondary bathroom tub or shower combo
Laundry
- Laundry Room
- Dryer
- Washer
Parking
- 2 Car Attached Garage
- Garage Door Opener
- Driveway
Pool
- Heated Spa
- In Ground Spa
Additional Features
- Ground Level
- Central Heating and Cooling System
Listing and Financial Details
- Assessor Parcel Number 626223082
Community Details
Overview
- Association fees include building & grounds, security, insurance, cable TV
- Palm Valley Country Club Subdivision
- On-Site Maintenance
- Greenbelt
- Planned Unit Development
Amenities
- Clubhouse
Recreation
- Golf Course Community
- Tennis Courts
- Fitness Center
- Community Pool
- Community Spa
Pet Policy
- Pets Allowed with Restrictions
Security
- Security Service
- 24 Hour Access
- Gated Community
Map
Home Values in the Area
Average Home Value in this Area
Tax History
| Year | Tax Paid | Tax Assessment Tax Assessment Total Assessment is a certain percentage of the fair market value that is determined by local assessors to be the total taxable value of land and additions on the property. | Land | Improvement |
|---|---|---|---|---|
| 2025 | $3,514 | $255,687 | $73,564 | $182,123 |
| 2023 | $3,514 | $245,759 | $70,708 | $175,051 |
| 2022 | $3,339 | $240,941 | $69,322 | $171,619 |
| 2021 | $3,258 | $236,217 | $67,963 | $168,254 |
| 2020 | $3,202 | $233,796 | $67,267 | $166,529 |
| 2019 | $3,147 | $229,213 | $65,949 | $163,264 |
| 2018 | $3,093 | $224,719 | $64,656 | $160,063 |
| 2017 | $3,056 | $220,314 | $63,389 | $156,925 |
| 2016 | $3,007 | $215,996 | $62,147 | $153,849 |
| 2015 | $3,019 | $212,753 | $61,214 | $151,539 |
| 2014 | $2,974 | $208,587 | $60,016 | $148,571 |
Property History
| Date | Event | Price | List to Sale | Price per Sq Ft |
|---|---|---|---|---|
| 10/20/2025 10/20/25 | For Sale | $429,950 | -- | $284 / Sq Ft |
Purchase History
| Date | Type | Sale Price | Title Company |
|---|---|---|---|
| Interfamily Deed Transfer | -- | None Available | |
| Interfamily Deed Transfer | -- | -- | |
| Individual Deed | -- | Commonwealth Land Title |
Mortgage History
| Date | Status | Loan Amount | Loan Type |
|---|---|---|---|
| Closed | $105,000 | Purchase Money Mortgage |
Source: California Desert Association of REALTORS®
MLS Number: 219137354
APN: 626-223-082
Disclaimer: Certain information contained herein is derived from information provided by parties other than Homes.com. All information provided is deemed reliable, but is not guaranteed to be accurate and should be independently verified.
![]() IDX information is provided exclusively for personal, non-commercial use, and may not be used for any purpose other than to identify prospective properties consumers may be interested in purchasing. Information is deemed reliable but not guaranteed.
IDX information is provided exclusively for personal, non-commercial use, and may not be used for any purpose other than to identify prospective properties consumers may be interested in purchasing. Information is deemed reliable but not guaranteed.
- 38497 Nasturtium Way
- 38517 Nasturtium Way
- 38453 Nasturtium Way
- 38417 Nasturtium Way
- 38399 Nasturtium Way
- 38354 Crocus Ln
- 38380 Crocus Ln
- 38750 Wisteria Dr
- 38849 Palm Valley Dr
- 38873 Palm Valley Dr
- 38315 Crocus Ln
- 38615 Palm Valley Dr
- 38488 Gazania Cir
- 38306 Gazania Cir
- 38487 Gazania Cir
- 38915 Wisteria Dr
- 38657 Dahlia Way
- 76546 Begonia Ln
- 76669 Begonia Ln
- 38263 Plumosa Cir Unit 1353
- 38613 Wisteria Dr
- 38921 Wisteria Dr
- 38101 Crocus Ln
- 76268 Impatiens Cir
- 38061 Crocus Ln
- 38780 Tandika Trail N
- 76269 Sweet Pea Way
- 38940 Tandika Trail N
- 38811 Tandika Trail N
- 39795 Regency Way
- 112 Rosetta Ct
- 145 Bellini Way
- 76238 Honeysuckle Dr
- 39080 Kilimanjaro Ct
- 685 Box Canyon Trail
- 679 Box Canyon Trail
- 763 Box Canyon Trail
- 781 Box Canyon Trail
- 524 Red Arrow Trail
- 39856 Narcissus Way
