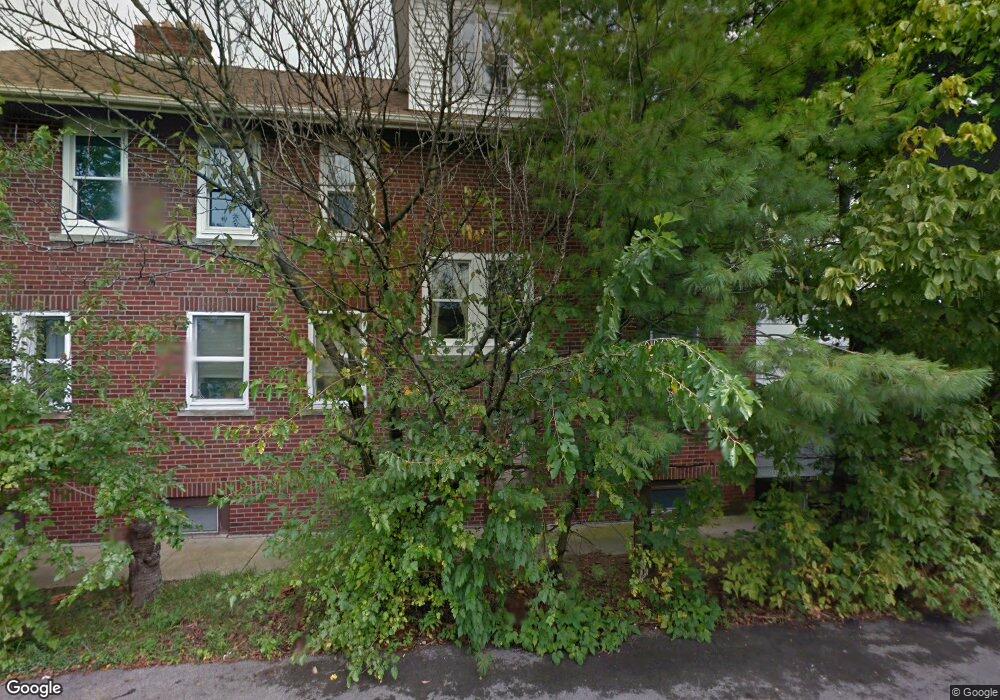
3855 E Broad St Unit 57 Whitehall, OH 43213
Estimated Value: $322,682
Studio
--
Bath
5,888
Sq Ft
$55/Sq Ft
Est. Value
About This Home
This home is located at 3855 E Broad St Unit 57, Whitehall, OH 43213 and is currently estimated at $322,682, approximately $54 per square foot. 3855 E Broad St Unit 57 is a home located in Franklin County with nearby schools including Beechwood Elementary School, Etna Road Elementary School, and Rosemore Middle School.
Ownership History
Date
Name
Owned For
Owner Type
Purchase Details
Closed on
Jan 11, 2023
Sold by
Mati Properties Llc
Bought by
Telhio Credit Union Inc
Current Estimated Value
Purchase Details
Closed on
Jan 24, 2022
Sold by
Lynn Boyer Vicki
Bought by
Mati Properties Llc
Home Financials for this Owner
Home Financials are based on the most recent Mortgage that was taken out on this home.
Original Mortgage
$100,000
Interest Rate
3.11%
Mortgage Type
New Conventional
Purchase Details
Closed on
Nov 22, 2021
Sold by
Lynn Boyer Vicki
Bought by
Mati Properties Llc
Home Financials for this Owner
Home Financials are based on the most recent Mortgage that was taken out on this home.
Original Mortgage
$100,000
Interest Rate
3.11%
Mortgage Type
New Conventional
Purchase Details
Closed on
Jun 29, 1978
Bought by
Boyer David M
Create a Home Valuation Report for This Property
The Home Valuation Report is an in-depth analysis detailing your home's value as well as a comparison with similar homes in the area
Home Values in the Area
Average Home Value in this Area
Purchase History
| Date | Buyer | Sale Price | Title Company |
|---|---|---|---|
| Telhio Credit Union Inc | $300,000 | Harrison Title | |
| Mati Properties Llc | $200,000 | First Ohio Title | |
| Mati Properties Llc | $200,000 | First Ohio Title | |
| Boyer David M | -- | -- |
Source: Public Records
Mortgage History
| Date | Status | Borrower | Loan Amount |
|---|---|---|---|
| Previous Owner | Mati Properties Llc | $100,000 | |
| Previous Owner | Mati Properties Llc | $100,000 |
Source: Public Records
Tax History
| Year | Tax Paid | Tax Assessment Tax Assessment Total Assessment is a certain percentage of the fair market value that is determined by local assessors to be the total taxable value of land and additions on the property. | Land | Improvement |
|---|---|---|---|---|
| 2025 | $6,435 | $85,160 | $85,160 | -- |
| 2024 | $6,435 | $85,160 | $85,160 | -- |
| 2023 | $8,336 | $104,590 | $38,330 | $66,260 |
| 2022 | $16,053 | $96,270 | $23,390 | $72,880 |
| 2021 | $7,542 | $96,270 | $23,390 | $72,880 |
| 2020 | $7,456 | $96,270 | $23,390 | $72,880 |
| 2019 | $7,127 | $87,510 | $21,250 | $66,260 |
| 2018 | $7,110 | $87,510 | $21,250 | $66,260 |
| 2017 | $6,951 | $87,510 | $21,250 | $66,260 |
| 2016 | $6,950 | $83,950 | $21,290 | $62,660 |
| 2015 | $7,011 | $83,950 | $21,290 | $62,660 |
| 2014 | $7,012 | $83,950 | $21,290 | $62,660 |
| 2013 | $3,186 | $77,000 | $20,055 | $56,945 |
Source: Public Records
Map
Nearby Homes
- 3857 Doney St
- 3814 Elbern Ave
- 3840 Elbern Ave
- 320 Collingwood Ave
- 68 S Weyant Ave
- 34 N Hampton Rd
- 50 N Hampton Rd
- 181 S Weyant Ave
- 73 N Hampton Rd
- 39 N Hampton Rd
- 4117 Elbern Ave
- 4148 Elbern Ave
- 269 S Weyant Ave
- 73 N Everett Ave
- 177 S Hampton Rd
- 0 S Napoleon Ave
- 290 S Hampton Rd
- 225 Santa Maria Ln
- 253 N James Rd
- 177 N James Rd
- 3855 E Broad St
- 3861 E Broad St
- 65 Robinwood Ave
- 29 Collingwood Ave
- 48 Collingwood Ave
- 23 Collingwood Ave
- 58 Collingwood Ave
- 33 Collingwood Ave
- 3791 E Broad St
- 39 Collingwood Ave
- 43 Collingwood Ave
- 37 Robinwood Ave
- 49 Collingwood Ave
- 76 Collingwood Ave
- 82 Collingwood Ave
- 86 Collingwood Ave
- 73 Collingwood Ave
- 79 Collingwood Ave
- 91 Rita Ct
- 94 Rita Ct
Your Personal Tour Guide
Ask me questions while you tour the home.