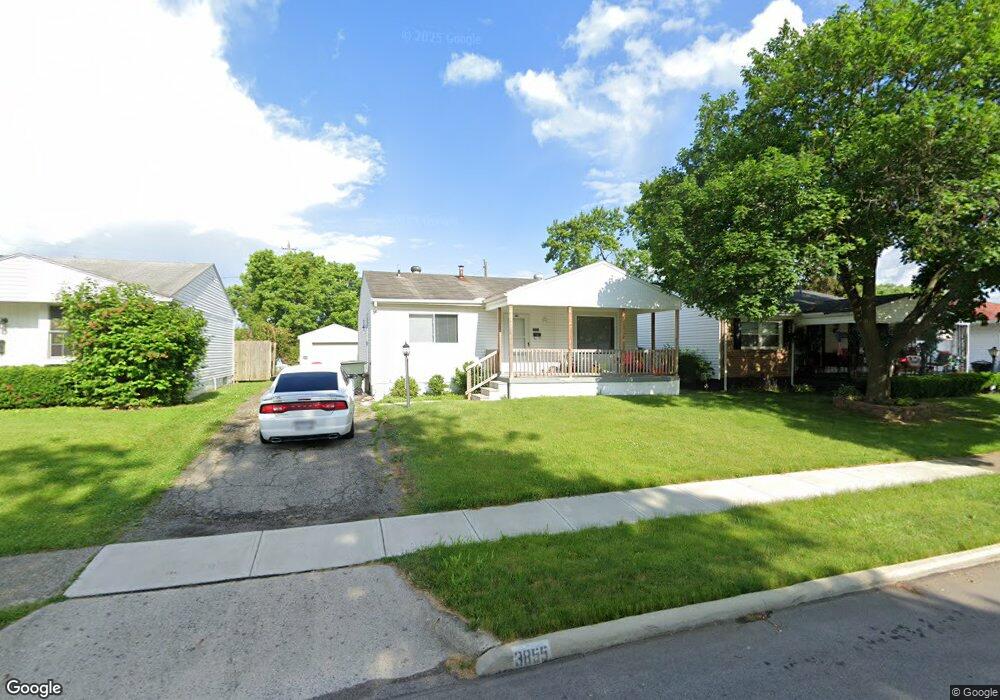
3855 Frazier Rd W Columbus, OH 43207
Obetz-Lockbourne NeighborhoodEstimated Value: $147,000 - $196,000
3
Beds
1
Bath
896
Sq Ft
$197/Sq Ft
Est. Value
About This Home
This home is located at 3855 Frazier Rd W, Columbus, OH 43207 and is currently estimated at $176,331, approximately $196 per square foot. 3855 Frazier Rd W is a home located in Franklin County with nearby schools including Cedarwood Alternative Elementary School @ Stockbri, Buckeye Middle School, and Marion-Franklin High School.
Ownership History
Date
Name
Owned For
Owner Type
Purchase Details
Closed on
Jun 15, 2011
Sold by
Hill David B and Hill Mary L
Bought by
Hill David B and Hill Mary L
Current Estimated Value
Purchase Details
Closed on
Jul 30, 2008
Sold by
Us Bank Na
Bought by
Hill David B
Purchase Details
Closed on
May 12, 2008
Sold by
Bradford Michael A and Case #07Cve05 6150
Bought by
Us Bank Na and Credit Suisse First Boston 2005-8
Purchase Details
Closed on
Jan 27, 2004
Sold by
Yinger Larry R and Yinger Ava
Bought by
Bradford Michael A
Home Financials for this Owner
Home Financials are based on the most recent Mortgage that was taken out on this home.
Original Mortgage
$64,800
Interest Rate
6.9%
Mortgage Type
Purchase Money Mortgage
Purchase Details
Closed on
Jun 1, 1987
Create a Home Valuation Report for This Property
The Home Valuation Report is an in-depth analysis detailing your home's value as well as a comparison with similar homes in the area
Home Values in the Area
Average Home Value in this Area
Purchase History
| Date | Buyer | Sale Price | Title Company |
|---|---|---|---|
| Hill David B | -- | Independent | |
| Hill David B | $56,000 | Accutitle Agency Inc | |
| Us Bank Na | $54,000 | None Available | |
| Bradford Michael A | $72,000 | Titlequest Agency Inc | |
| -- | $47,500 | -- |
Source: Public Records
Mortgage History
| Date | Status | Borrower | Loan Amount |
|---|---|---|---|
| Previous Owner | Bradford Michael A | $64,800 |
Source: Public Records
Tax History Compared to Growth
Tax History
| Year | Tax Paid | Tax Assessment Tax Assessment Total Assessment is a certain percentage of the fair market value that is determined by local assessors to be the total taxable value of land and additions on the property. | Land | Improvement |
|---|---|---|---|---|
| 2024 | $2,231 | $48,690 | $12,250 | $36,440 |
| 2023 | $2,204 | $48,685 | $12,250 | $36,435 |
| 2022 | $1,592 | $29,960 | $8,050 | $21,910 |
| 2021 | $1,595 | $29,960 | $8,050 | $21,910 |
| 2020 | $1,597 | $29,960 | $8,050 | $21,910 |
| 2019 | $1,658 | $26,670 | $7,000 | $19,670 |
| 2018 | $828 | $26,670 | $7,000 | $19,670 |
| 2017 | $1,544 | $26,670 | $7,000 | $19,670 |
| 2016 | $1,429 | $21,040 | $4,480 | $16,560 |
| 2015 | $651 | $21,040 | $4,480 | $16,560 |
| 2014 | $1,305 | $21,040 | $4,480 | $16,560 |
| 2013 | $757 | $24,745 | $5,250 | $19,495 |
Source: Public Records
Map
Nearby Homes
- 552 Harland Dr
- 0 Parsons Ave Unit 225012522
- 568 Glendora Rd
- 3714 Parsons Ave
- 3691 Ferman Rd
- 312 Harland Dr
- 503 Ashwood Rd
- 525 Ashwood Rd
- 3735 Christie Rd W
- 3691 Abney Rd
- 3940 Hillman Rd W
- 812 Breathitt Ave
- 4141 Kershaw Dr
- 4132 Martinsburg Dr
- 4125 Martinsburg Dr
- 245 Marilla Rd
- 904 Kyle Ave
- 0 Jana Kay Ct
- 864 Robmeyer Dr
- 3414 Parsons Ave
- 3849 Frazier Rd W
- 3841 Frazier Rd W
- 3869 Frazier Rd W
- 3835 Frazier Rd W
- 3828 Harland Ct
- 3879 Frazier Rd W
- 3860 Frazier Rd W
- 3850 Frazier Rd W
- 3866 Frazier Rd W
- 3866 Frazier Rd W
- 0 W Frazier Rd W
- 3844 Frazier Rd W
- 3822 Harland Ct
- 3874 Frazier Rd W
- 3829 Frazier Rd W
- 3838 Frazier Rd W
- 3887 Frazier Rd W
- 3829 Harland Ct
- 3882 Frazier Rd W
- 3680 Frazier Rd W