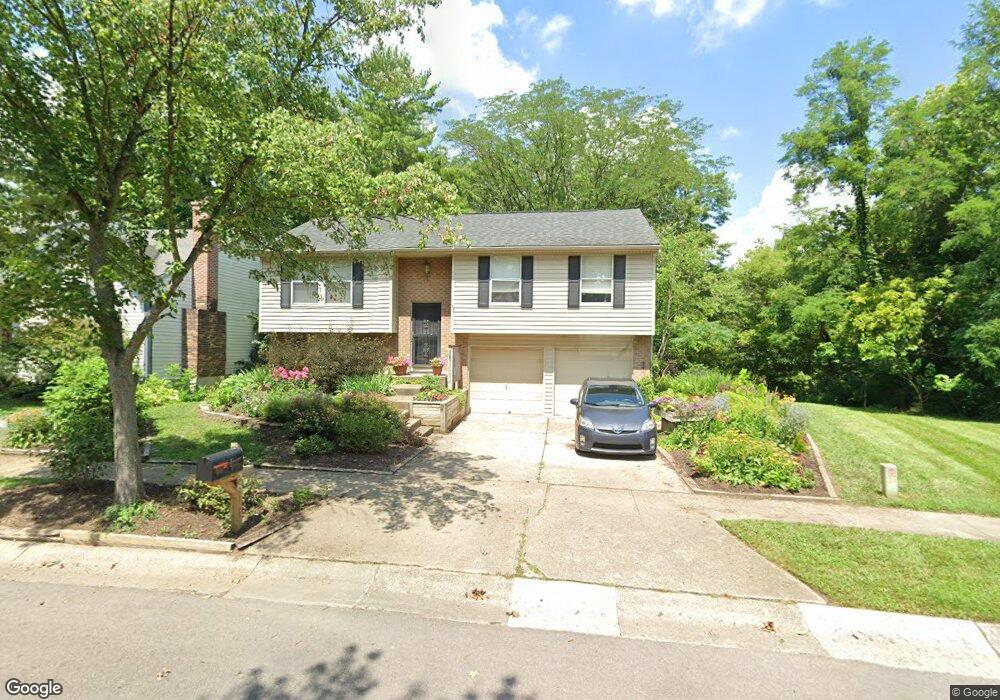
3856 Spring Mill Way Maineville, OH 45039
Landen NeighborhoodEstimated Value: $325,000 - $344,000
3
Beds
2
Baths
1,356
Sq Ft
$245/Sq Ft
Est. Value
About This Home
This home is located at 3856 Spring Mill Way, Maineville, OH 45039 and is currently estimated at $332,178, approximately $244 per square foot. 3856 Spring Mill Way is a home located in Warren County with nearby schools including Kings Junior High School, Kings High School, and King Of Kings Lutheran Early Childhood Education.
Ownership History
Date
Name
Owned For
Owner Type
Purchase Details
Closed on
Oct 4, 1996
Sold by
Powell Chris L
Bought by
Andrew Stephen R
Current Estimated Value
Home Financials for this Owner
Home Financials are based on the most recent Mortgage that was taken out on this home.
Original Mortgage
$104,400
Outstanding Balance
$5,749
Interest Rate
7.63%
Mortgage Type
New Conventional
Estimated Equity
$326,429
Purchase Details
Closed on
Oct 2, 1992
Sold by
Taflan Taflan and Taflan Ronald D
Bought by
Powell Powell and Powell Chris L
Purchase Details
Closed on
Aug 29, 1989
Sold by
Wonder Wonder and Wonder Richard
Bought by
Taflan Taflan and Taflan Ronald D
Purchase Details
Closed on
Jun 2, 1986
Sold by
Ryland Group & Inc
Bought by
Wonder Wonder and Wonder Richard
Purchase Details
Closed on
Dec 30, 1985
Sold by
Landen Farm Company
Bought by
Ryland Group & Inc
Purchase Details
Closed on
Apr 20, 1984
Sold by
Landen Farm Company
Bought by
Landen Farm Company
Create a Home Valuation Report for This Property
The Home Valuation Report is an in-depth analysis detailing your home's value as well as a comparison with similar homes in the area
Home Values in the Area
Average Home Value in this Area
Purchase History
We collect this data history from publicly available records. To have your information removed, we recommend requesting removal directly through your county’s website.
| Date | Buyer | Sale Price | Title Company |
|---|---|---|---|
| Andrew Stephen R | $109,900 | -- | |
| Powell Powell | $92,000 | -- | |
| Taflan Taflan | $85,200 | -- | |
| Wonder Wonder | $67,900 | -- | |
| Ryland Group & Inc | $100,000 | -- | |
| Landen Farm Company | -- | -- |
Source: Public Records
Mortgage History
We collect this data history from publicly available records. To have your information removed, we recommend requesting removal directly through your county’s website.
| Date | Status | Borrower | Loan Amount |
|---|---|---|---|
| Open | Andrew Stephen R | $104,400 |
Source: Public Records
Tax History
| Year | Tax Paid | Tax Assessment Tax Assessment Total Assessment is a certain percentage of the fair market value that is determined by local assessors to be the total taxable value of land and additions on the property. | Land | Improvement |
|---|---|---|---|---|
| 2025 | $4,407 | $84,330 | $26,250 | $58,080 |
| 2024 | $4,407 | $84,330 | $26,250 | $58,080 |
| 2023 | $3,749 | $64,407 | $12,915 | $51,492 |
| 2022 | $3,679 | $64,407 | $12,915 | $51,492 |
| 2021 | $3,083 | $64,407 | $12,915 | $51,492 |
| 2020 | $2,980 | $52,364 | $10,500 | $41,864 |
| 2019 | $3,015 | $52,364 | $10,500 | $41,864 |
| 2018 | $2,992 | $52,364 | $10,500 | $41,864 |
| 2017 | $2,926 | $45,196 | $10,371 | $34,825 |
| 2016 | $3,000 | $45,196 | $10,371 | $34,825 |
| 2015 | $2,544 | $45,196 | $10,371 | $34,825 |
| 2014 | $2,544 | $39,990 | $9,180 | $30,820 |
| 2013 | $2,548 | $45,760 | $10,500 | $35,260 |
Source: Public Records
Map
Nearby Homes
- 8839 Pollard Place
- 9491 Carriage Run Cir
- 9388 Hickory Hill Ct
- 3237 S Cove Ct
- 9642 Old Village Dr
- 3222 Locust Ave
- 3516 Cutter Ln
- 9282 Greenery Ct Unit 311E
- 8188 Columbia Rd
- 9434 Greenery Ct
- 3444 Cutter Ln
- 9594 Greenery Ct
- 3556 Twenty Mile Way Unit 3556
- 8833 Dover Dr
- 4098 Crestview Dr
- 4827 Old Irwin Simpson Rd
- 2898 Mossy Brink Ct Unit 19
- 7824 Golden Meadow Dr
- 4395 S Mallard Cove
- 2859 Mossy Brink Ct
- 3857 Spring Mill Way
- 3807 Spring Mill Way
- 3785 Spring Mill Way
- 3867 Spring Mill Way
- 3836 Spring Mill Way
- 3828 Spring Mill Way
- 3771 Spring Mill Way
- 3842 Spring Mill Way
- 3816 Spring Mill Way
- 3879 Spring Mill Way
- 3808 Spring Mill Way
- 3763 Spring Mill Way
- 3866 Spring Mill Way
- 3794 Spring Mill Way
- 3874 Spring Mill Way
- 3891 Spring Mill Way
- 3780 Spring Mill Way
- 3749 Spring Mill Way
- 3884 Spring Mill Way
- 3770 Spring Mill Way
Your Personal Tour Guide
Ask me questions while you tour the home.