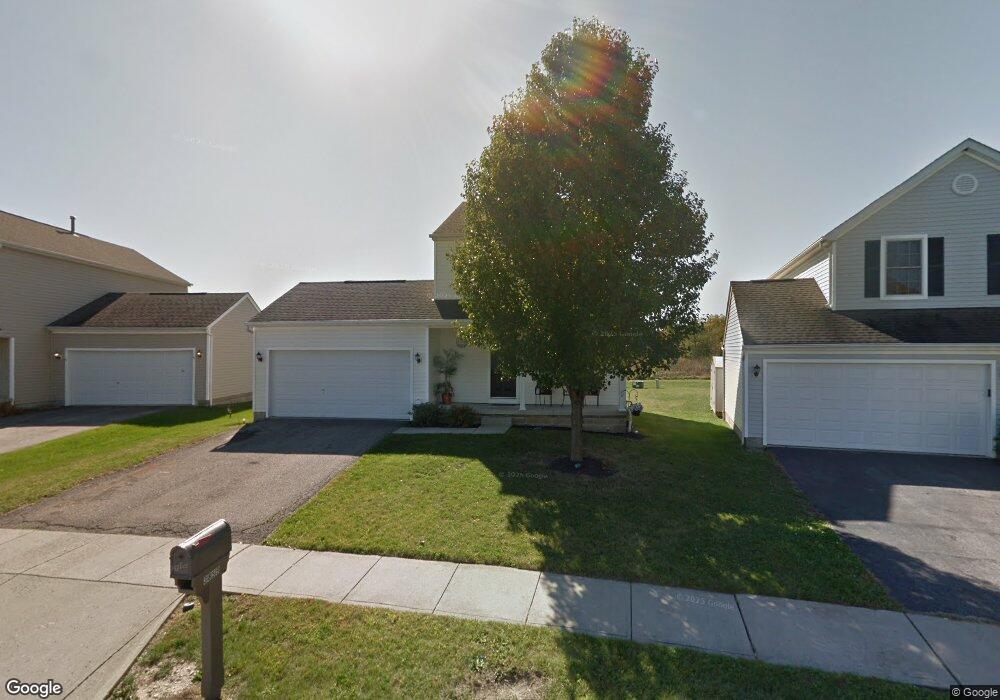
3859 Pendent Ln Columbus, OH 43207
Williams Creek NeighborhoodEstimated Value: $247,145 - $281,000
3
Beds
3
Baths
1,280
Sq Ft
$201/Sq Ft
Est. Value
About This Home
This home is located at 3859 Pendent Ln, Columbus, OH 43207 and is currently estimated at $257,536, approximately $201 per square foot. 3859 Pendent Ln is a home located in Franklin County with nearby schools including Groveport Madison High School, South Columbus Preparatory Academy at Southfield, and South Scioto Academy.
Ownership History
Date
Name
Owned For
Owner Type
Purchase Details
Closed on
Feb 2, 2012
Sold by
Gueye Mariem
Bought by
Ah4r Oh Llc
Current Estimated Value
Purchase Details
Closed on
Mar 30, 2010
Sold by
Secretary Of Housing & Urban Development
Bought by
Gueye Mariem
Home Financials for this Owner
Home Financials are based on the most recent Mortgage that was taken out on this home.
Original Mortgage
$68,172
Interest Rate
3.62%
Mortgage Type
FHA
Purchase Details
Closed on
Jun 20, 2008
Sold by
Carlson Charles D and National City Mortgage Co
Bought by
Hud
Purchase Details
Closed on
Apr 16, 2004
Sold by
Dominion Homes Inc
Bought by
Carlson Charles D and Carlson Charlotte L
Home Financials for this Owner
Home Financials are based on the most recent Mortgage that was taken out on this home.
Original Mortgage
$145,079
Interest Rate
5.48%
Mortgage Type
FHA
Create a Home Valuation Report for This Property
The Home Valuation Report is an in-depth analysis detailing your home's value as well as a comparison with similar homes in the area
Home Values in the Area
Average Home Value in this Area
Purchase History
| Date | Buyer | Sale Price | Title Company |
|---|---|---|---|
| Ah4r Oh Llc | -- | None Available | |
| Gueye Mariem | $70,101 | Lakeside Ti | |
| Hud | $80,000 | Allodial | |
| Carlson Charles D | $146,300 | Alliance Title |
Source: Public Records
Mortgage History
| Date | Status | Borrower | Loan Amount |
|---|---|---|---|
| Previous Owner | Gueye Mariem | $68,172 | |
| Previous Owner | Carlson Charles D | $145,079 |
Source: Public Records
Tax History
| Year | Tax Paid | Tax Assessment Tax Assessment Total Assessment is a certain percentage of the fair market value that is determined by local assessors to be the total taxable value of land and additions on the property. | Land | Improvement |
|---|---|---|---|---|
| 2025 | $3,543 | $81,630 | $24,750 | $56,880 |
| 2024 | $3,543 | $81,630 | $24,750 | $56,880 |
| 2023 | $3,510 | $81,620 | $24,745 | $56,875 |
| 2022 | $2,421 | $46,830 | $8,400 | $38,430 |
| 2021 | $2,428 | $46,830 | $8,400 | $38,430 |
| 2020 | $2,432 | $46,830 | $8,400 | $38,430 |
| 2019 | $2,370 | $40,810 | $7,000 | $33,810 |
| 2018 | $2,235 | $40,810 | $7,000 | $33,810 |
| 2017 | $2,394 | $40,810 | $7,000 | $33,810 |
| 2016 | $1,864 | $29,050 | $7,840 | $21,210 |
| 2015 | $2,083 | $31,500 | $7,840 | $23,660 |
| 2014 | $2,382 | $36,300 | $7,840 | $28,460 |
| 2013 | $1,214 | $42,665 | $9,205 | $33,460 |
Source: Public Records
Map
Nearby Homes
- 3847 Pendent Ln
- 3782 Willowtree Ln
- 3768 Pendent Ln
- 3688 Tea Party Place Unit 273
- 3950 Wintercress Ct
- 3939 Marsha Dr
- 2629 Patrick Henry Ave Unit 40
- 3516 Meadow Valley St
- 4142 Oldentime Ct
- 2883 Valley Green Dr
- 2697 Meigs Dr
- 2693 Meigs Dr
- 2689 Meigs Dr
- 2685 Meigs Dr
- 2681 Meigs Dr
- 2690 Meigs Dr
- 2686 Meigs Dr
- 2682 Meigs Dr
- 2674 Meigs Dr
- 2747 Mchenry Dr
- 3853 Pendent Ln
- 3841 Pendent Ln
- 3842 Pendent Ln
- 3857 Willowswitch Ln
- 3839 Willowswitch Ln
- 3863 Willowswitch Ln
- 3835 Pendent Ln
- 3833 Willowswitch Ln
- 3833 Willowswitch Ln Unit 184
- 3828 Pendent Ln
- 3829 Pendent Ln
- 2610 Weeping Willow Ct
- 3827 Willowswitch Ln
- 3827 Willowswitch Ln Unit 185
- 3867 Barkwillow Ln
- 2604 Weeping Willow Ct
- 3861 Barkwillow Ln
- 3855 Barkwillow Ln
- 3822 Pendent Ln
- 3822 Pendent Ln
Your Personal Tour Guide
Ask me questions while you tour the home.