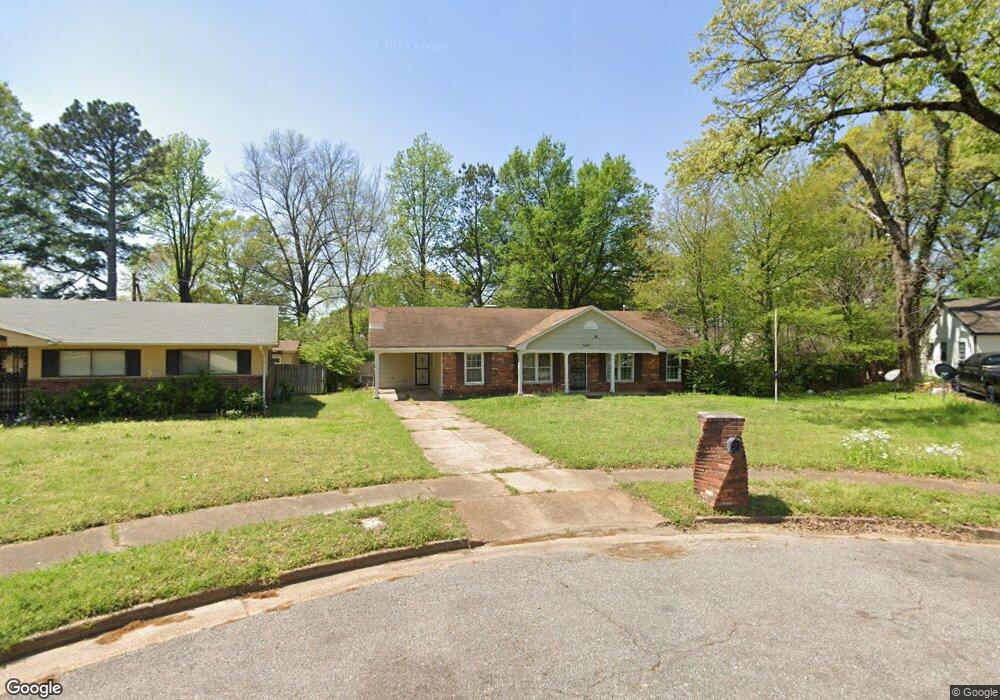
3859 Warrington Cove Memphis, TN 38118
Parkway Village NeighborhoodEstimated Value: $128,000 - $164,000
3
Beds
2
Baths
1,555
Sq Ft
$95/Sq Ft
Est. Value
About This Home
This home is located at 3859 Warrington Cove, Memphis, TN 38118 and is currently estimated at $148,431, approximately $95 per square foot. 3859 Warrington Cove is a home located in Shelby County with nearby schools including Cromwell Elementary School, Wooddale High School, and Compass Community School Hickory Hill Campus.
Ownership History
Date
Name
Owned For
Owner Type
Purchase Details
Closed on
May 16, 2011
Sold by
Fisher Rollie and Fisher Eloise W
Bought by
David & Rebecca Corporation
Current Estimated Value
Purchase Details
Closed on
Jul 28, 2006
Sold by
Mcdonald Henry M
Bought by
Fisher Rollie
Home Financials for this Owner
Home Financials are based on the most recent Mortgage that was taken out on this home.
Original Mortgage
$75,840
Interest Rate
8.75%
Mortgage Type
Stand Alone First
Purchase Details
Closed on
Mar 5, 2003
Sold by
Munn Johnny R and Munn Chondrus R
Bought by
Bank Of Alabama
Purchase Details
Closed on
Nov 30, 2000
Sold by
Jones Isaac
Bought by
Munn Johnny R and Munn Chondrus R
Home Financials for this Owner
Home Financials are based on the most recent Mortgage that was taken out on this home.
Original Mortgage
$75,600
Interest Rate
12.5%
Purchase Details
Closed on
Sep 23, 1999
Sold by
Bailey Linda D and Bailey Robert A
Bought by
Hud
Create a Home Valuation Report for This Property
The Home Valuation Report is an in-depth analysis detailing your home's value as well as a comparison with similar homes in the area
Home Values in the Area
Average Home Value in this Area
Purchase History
| Date | Buyer | Sale Price | Title Company |
|---|---|---|---|
| David & Rebecca Corporation | $35,500 | None Available | |
| Fisher Rollie | $94,800 | Absolute Title & Escrow | |
| Bank Of Alabama | $75,387 | -- | |
| Munn Johnny R | $84,000 | Equity Title & Escrow Co | |
| Hud | $78,136 | -- |
Source: Public Records
Mortgage History
| Date | Status | Borrower | Loan Amount |
|---|---|---|---|
| Previous Owner | Fisher Rollie | $75,840 | |
| Previous Owner | Munn Johnny R | $75,600 |
Source: Public Records
Tax History Compared to Growth
Tax History
| Year | Tax Paid | Tax Assessment Tax Assessment Total Assessment is a certain percentage of the fair market value that is determined by local assessors to be the total taxable value of land and additions on the property. | Land | Improvement |
|---|---|---|---|---|
| 2025 | $820 | $36,250 | $4,300 | $31,950 |
| 2024 | $820 | $24,200 | $3,550 | $20,650 |
| 2023 | $1,474 | $24,200 | $3,550 | $20,650 |
| 2022 | $1,474 | $24,200 | $3,550 | $20,650 |
| 2021 | $1,491 | $24,200 | $3,550 | $20,650 |
| 2020 | $1,393 | $19,225 | $3,550 | $15,675 |
| 2019 | $1,393 | $19,225 | $3,550 | $15,675 |
| 2018 | $1,393 | $19,225 | $3,550 | $15,675 |
| 2017 | $790 | $19,225 | $3,550 | $15,675 |
| 2016 | $790 | $18,075 | $0 | $0 |
| 2014 | $790 | $18,075 | $0 | $0 |
Source: Public Records
Map
Nearby Homes
- 3763 Clearbrook St
- 4915 Foxhall Cove
- 3687 King James Dr
- 3656 Outland Rd Unit 95
- 3629 Chesterwood Dr Unit 77
- 4787 Townhouse Way
- 3626 Outland Rd Unit 86
- 4772 James Kent Ct
- 5193 Flowering Peach Dr Unit T6
- 5192 Flowering Peach Dr Unit T3
- 5211 Flowering Peach Dr Unit S7
- 5237 Flowering Peach Dr Unit Q7
- 5250 Flowering Peach Dr Unit 1
- 5275 Flowering Peach Dr
- 3757 Cambridge Station Dr
- 3515 Wooddale Cove
- 5284 Flowering Peach Dr Unit J3
- 3746 Cambridge Station Dr
- 3766 Cambridge Station Dr
- 4817 Wooddale Ave
- 3865 Warrington Cove
- 3851 Warrington Cove
- 3858 Marston Rd
- 3852 Marston Rd
- 3864 Marston Rd
- 3853 Warrington Cove
- 3873 Warrington Cove
- 3844 Marston Rd
- 3872 Marston Rd
- 3856 Warrington Cove
- 3864 Warrington Cove
- 3858 Warrington Cove
- 3838 Marston Rd
- 3881 Warrington Cove
- 3829 Leven Cove
- 3880 Marston Rd
- 3872 Warrington Cove
- 3830 Leven Cove
- 3859 Marston Rd
- 4930 Clearbrook Cove