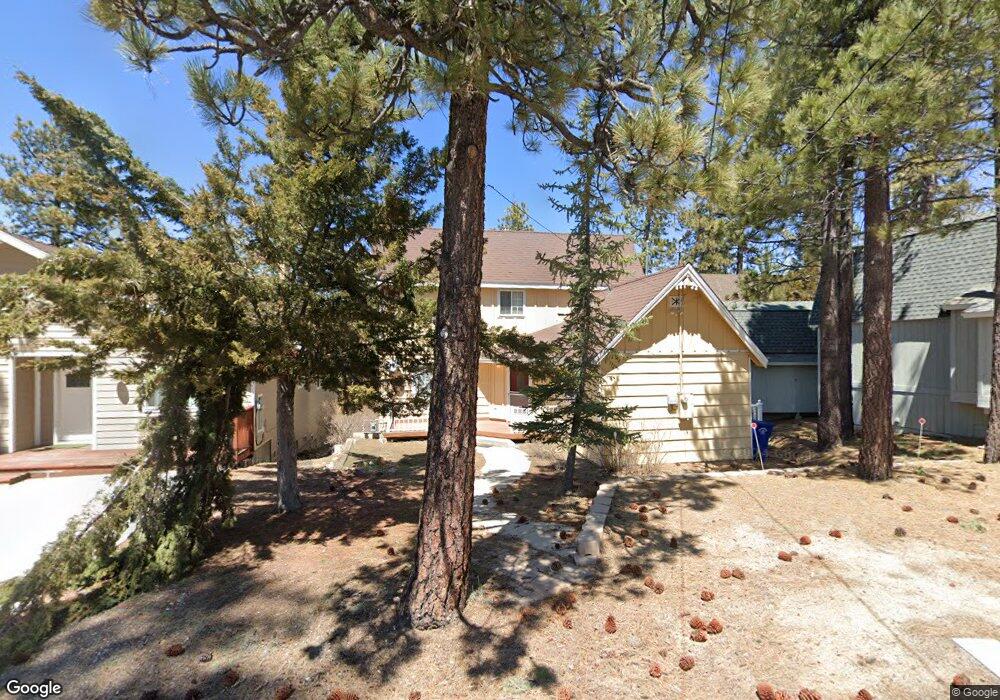
386 Canvasback Rd Big Bear Lake, CA 92315
Estimated Value: $401,000 - $586,000
3
Beds
1
Bath
1,315
Sq Ft
$385/Sq Ft
Est. Value
About This Home
This home is located at 386 Canvasback Rd, Big Bear Lake, CA 92315 and is currently estimated at $505,700, approximately $384 per square foot. 386 Canvasback Rd is a home with nearby schools including Big Bear Middle School and Big Bear High School.
Ownership History
Date
Name
Owned For
Owner Type
Purchase Details
Closed on
Sep 3, 2014
Sold by
Lohla Jerry A and Lohla Roberta J
Bought by
The Roberta & Jerry Lohla Trust
Current Estimated Value
Purchase Details
Closed on
Mar 10, 2014
Sold by
Cristler Clarence E and Cristler Corrine G
Bought by
Lohla Jerry A and Lohla Roberta J
Purchase Details
Closed on
Jul 17, 2006
Sold by
Cristler Clarence E and Cristler Corrine
Bought by
Cristler Clarence E and Cristler Corrine G
Purchase Details
Closed on
Oct 10, 2000
Sold by
Sawyer Douglas Arthur and Sawyer Mary
Bought by
Cristler Clarence E and Cristler Corrine
Home Financials for this Owner
Home Financials are based on the most recent Mortgage that was taken out on this home.
Original Mortgage
$70,000
Interest Rate
7.88%
Create a Home Valuation Report for This Property
The Home Valuation Report is an in-depth analysis detailing your home's value as well as a comparison with similar homes in the area
Home Values in the Area
Average Home Value in this Area
Purchase History
| Date | Buyer | Sale Price | Title Company |
|---|---|---|---|
| The Roberta & Jerry Lohla Trust | -- | None Available | |
| Lohla Jerry A | -- | None Available | |
| Lohla Jerry A | $290,000 | Investors Title Company | |
| Cristler Clarence E | -- | None Available | |
| Cristler Clarence E | $120,000 | Fidelity National Title Ins |
Source: Public Records
Mortgage History
| Date | Status | Borrower | Loan Amount |
|---|---|---|---|
| Previous Owner | Cristler Clarence E | $70,000 |
Source: Public Records
Tax History
| Year | Tax Paid | Tax Assessment Tax Assessment Total Assessment is a certain percentage of the fair market value that is determined by local assessors to be the total taxable value of land and additions on the property. | Land | Improvement |
|---|---|---|---|---|
| 2025 | $5,089 | $355,502 | $73,553 | $281,949 |
| 2024 | $4,917 | $348,532 | $72,111 | $276,421 |
| 2023 | $4,755 | $341,698 | $70,697 | $271,001 |
| 2022 | $4,550 | $334,998 | $69,311 | $265,687 |
| 2021 | $4,420 | $328,429 | $67,952 | $260,477 |
| 2020 | $4,472 | $325,061 | $67,255 | $257,806 |
| 2019 | $4,365 | $318,687 | $65,936 | $252,751 |
| 2018 | $4,221 | $312,438 | $64,643 | $247,795 |
| 2017 | $4,114 | $306,311 | $63,375 | $242,936 |
| 2016 | $4,025 | $300,305 | $62,132 | $238,173 |
| 2015 | $3,992 | $295,794 | $61,199 | $234,595 |
| 2014 | $2,316 | $147,508 | $36,879 | $110,629 |
Source: Public Records
Map
Nearby Homes
- 425 Castella Ln
- 448 Edgemoor Rd
- 294 Edgemoor Rd
- 39900 Forest Rd
- 39934 Forest Rd
- 446 Shady Ln
- 39656 Forest Rd
- 39961 Lakeview Dr
- 195 Knoll Rd
- 438 Boyd Trail
- 195 Elgin Rd
- 560 Edgemoor Rd
- 725 Edgemoor Rd
- 0 Arroyo Dr
- 534 Highland Rd
- 628 Bayview Rd
- 435 Arroyo Dr
- 665 Metcalf Ln
- 545 Highland Ln
- 667 Lintner Rd
- 382 Canvasback Rd
- 390 Canvasback Dr
- 0 Castella Ln Unit PW23124647
- 0 Castella Ln Unit 32301073
- 0 Castella Ln Unit 526091
- 0 Castella Ln
- 350 Chipowood Ln
- 380 Canvasback Dr
- 380 Canvasback Rd
- 392 Canvasback Rd
- 389 Canvasback Rd
- 398 Canvasback Rd
- 397 Canvasback Dr
- 397 Canvass Back Rd
- 397 Canvasback Rd
- 385 Canvasback Rd
- 383 Canvasback Rd
- 403 Canvasback Rd
- 393 Edgemoor Rd
- 39821 Forest Rd
Your Personal Tour Guide
Ask me questions while you tour the home.