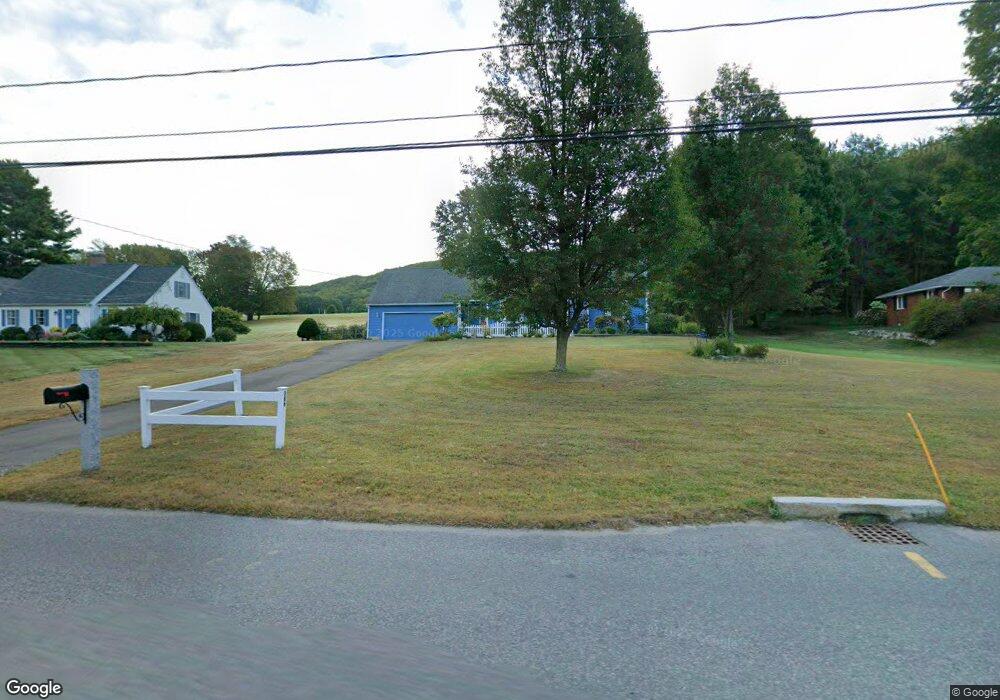
386 East St Easthampton, MA 01027
Estimated Value: $489,000 - $551,195
4
Beds
3
Baths
1,925
Sq Ft
$270/Sq Ft
Est. Value
About This Home
This home is located at 386 East St, Easthampton, MA 01027 and is currently estimated at $519,299, approximately $269 per square foot. 386 East St is a home located in Hampshire County with nearby schools including Easthampton High School, Hilltown Cooperative Charter Public School, and Tri-County Schools.
Ownership History
Date
Name
Owned For
Owner Type
Purchase Details
Closed on
Jul 7, 2017
Sold by
Mundy Paul R
Bought by
Osborne Cynthia D and Osborne Heather D
Current Estimated Value
Purchase Details
Closed on
Mar 30, 1998
Sold by
Riley Christopher and Riley Maria A
Bought by
Mundy Doris J and Mundy Paul R
Home Financials for this Owner
Home Financials are based on the most recent Mortgage that was taken out on this home.
Original Mortgage
$87,500
Interest Rate
6.96%
Mortgage Type
Purchase Money Mortgage
Create a Home Valuation Report for This Property
The Home Valuation Report is an in-depth analysis detailing your home's value as well as a comparison with similar homes in the area
Home Values in the Area
Average Home Value in this Area
Purchase History
| Date | Buyer | Sale Price | Title Company |
|---|---|---|---|
| Osborne Cynthia D | -- | -- | |
| Mundy Doris J | $175,000 | -- |
Source: Public Records
Mortgage History
| Date | Status | Borrower | Loan Amount |
|---|---|---|---|
| Previous Owner | Mundy Doris J | $87,500 | |
| Previous Owner | Mundy Doris J | $152,000 | |
| Previous Owner | Mundy Doris J | $129,600 | |
| Previous Owner | Mundy Doris J | $135,200 |
Source: Public Records
Tax History
| Year | Tax Paid | Tax Assessment Tax Assessment Total Assessment is a certain percentage of the fair market value that is determined by local assessors to be the total taxable value of land and additions on the property. | Land | Improvement |
|---|---|---|---|---|
| 2025 | $6,392 | $467,600 | $122,900 | $344,700 |
| 2024 | $6,174 | $455,300 | $119,300 | $336,000 |
| 2023 | $4,619 | $315,300 | $94,600 | $220,700 |
| 2022 | $5,212 | $315,300 | $94,600 | $220,700 |
| 2021 | $5,760 | $328,400 | $94,600 | $233,800 |
| 2020 | $5,600 | $315,300 | $94,600 | $220,700 |
| 2019 | $4,674 | $302,300 | $94,600 | $207,700 |
| 2018 | $4,509 | $281,800 | $89,300 | $192,500 |
| 2017 | $4,404 | $271,700 | $85,800 | $185,900 |
| 2016 | $4,440 | $284,800 | $85,800 | $199,000 |
| 2015 | $4,315 | $284,800 | $85,800 | $199,000 |
Source: Public Records
Map
Nearby Homes
- 2 Oak St
- 19 Mount Tom Ave Unit 19
- 33 Knipfer Ave
- 12 Glen Cove Place Unit B
- 10 Glen Cove Place Unit A
- 19 Nicols Way Unit 19
- 11 Dragon Cir
- 36 & 36R Holly Cir
- 6 S St & Abutting Lots
- 41 South St Unit 11
- 2 W Park Dr
- 336 Main St
- 385 Main St
- M143 &152 Glendale St
- 245 Park St
- 4 Laurel Dr
- Lot 1 Edgewater Ln
- 29 Sandra Rd
- 457 Northampton St
- 131 West St Unit 131
Your Personal Tour Guide
Ask me questions while you tour the home.