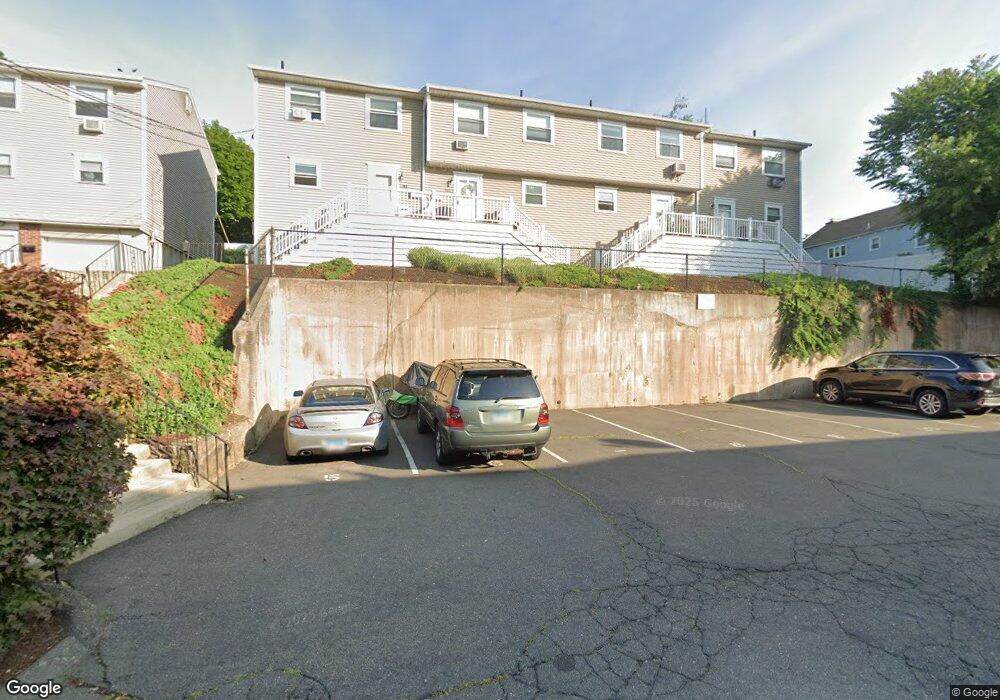
386 Halley Ave Fairfield, CT 06825
Tunxis Hill NeighborhoodEstimated Value: $369,000 - $389,000
2
Beds
2
Baths
1,200
Sq Ft
$315/Sq Ft
Est. Value
About This Home
This home is located at 386 Halley Ave, Fairfield, CT 06825 and is currently estimated at $378,024, approximately $315 per square foot. 386 Halley Ave is a home located in Fairfield County with nearby schools including Mckinley Elementary School, Tomlinson Middle School, and Fairfield Warde High School.
Ownership History
Date
Name
Owned For
Owner Type
Purchase Details
Closed on
Aug 15, 2024
Sold by
Mckenna John F
Bought by
Grzymala Joanna
Current Estimated Value
Home Financials for this Owner
Home Financials are based on the most recent Mortgage that was taken out on this home.
Original Mortgage
$279,920
Outstanding Balance
$276,801
Interest Rate
6.95%
Mortgage Type
Purchase Money Mortgage
Estimated Equity
$101,223
Purchase Details
Closed on
Aug 2, 2017
Sold by
Lake Deborah A
Bought by
Mckenna John F
Home Financials for this Owner
Home Financials are based on the most recent Mortgage that was taken out on this home.
Original Mortgage
$100,000
Interest Rate
3.9%
Mortgage Type
Purchase Money Mortgage
Purchase Details
Closed on
Feb 11, 2000
Sold by
Damato John E
Bought by
Lake Deborah A
Purchase Details
Closed on
Feb 27, 1989
Sold by
Charlamb Donald R
Bought by
Damato John E
Create a Home Valuation Report for This Property
The Home Valuation Report is an in-depth analysis detailing your home's value as well as a comparison with similar homes in the area
Home Values in the Area
Average Home Value in this Area
Purchase History
| Date | Buyer | Sale Price | Title Company |
|---|---|---|---|
| Grzymala Joanna | $349,900 | None Available | |
| Grzymala Joanna | $349,900 | None Available | |
| Grzymala Joanna | $349,900 | None Available | |
| Mckenna John F | $215,000 | -- | |
| Mckenna John F | $215,000 | -- | |
| Lake Deborah A | $119,000 | -- | |
| Lake Deborah A | $119,000 | -- | |
| Damato John E | $130,000 | -- |
Source: Public Records
Mortgage History
| Date | Status | Borrower | Loan Amount |
|---|---|---|---|
| Open | Grzymala Joanna | $279,920 | |
| Closed | Grzymala Joanna | $279,920 | |
| Previous Owner | Damato John E | $100,000 |
Source: Public Records
Tax History Compared to Growth
Tax History
| Year | Tax Paid | Tax Assessment Tax Assessment Total Assessment is a certain percentage of the fair market value that is determined by local assessors to be the total taxable value of land and additions on the property. | Land | Improvement |
|---|---|---|---|---|
| 2025 | $4,732 | $166,670 | $0 | $166,670 |
| 2024 | $4,650 | $166,670 | $0 | $166,670 |
| 2023 | $4,585 | $166,670 | $0 | $166,670 |
| 2022 | $4,540 | $166,670 | $0 | $166,670 |
| 2021 | $4,497 | $166,670 | $0 | $166,670 |
| 2020 | $4,715 | $175,980 | $0 | $175,980 |
| 2019 | $4,715 | $175,980 | $0 | $175,980 |
| 2018 | $4,639 | $175,980 | $0 | $175,980 |
| 2017 | $4,544 | $175,980 | $0 | $175,980 |
| 2016 | $4,479 | $175,980 | $0 | $175,980 |
| 2015 | $4,125 | $166,390 | $0 | $166,390 |
| 2014 | $4,060 | $166,390 | $0 | $166,390 |
Source: Public Records
Map
Nearby Homes
- 378 Castle Ave
- 89 Grace St
- 145 Brentwood Ave
- 130 Brentwood Ave
- 118 Berwick Ave
- 270 Andrassy Ave
- 221 Hunyadi Ave
- 101 Soundview Ave
- 62 Soundview Ave
- 162 Country Rd Unit 162
- 309 Hunyadi Ave
- 108 Roseville St
- 25 Country Rd
- 274 High St
- 709 Tunxis Hill Rd
- 109 Jeniford Rd
- 180 Oakwood Dr
- 183 Vesper St
- 197 Vesper St
- 155 Moody Ave
- 386 Halley Ave Unit 386
- 384 Halley Ave
- 384 Halley Ave Unit 384
- 382 Halley Ave
- 382 Halley Ave Unit 382
- 380 Halley Ave
- 380 Halley Ave Unit 380
- 185 Longfellow Ave
- 374 Halley Ave
- 374 Halley Ave Unit 374
- 26 Poe Ct
- 42 Poe Ct
- 372 Halley Ave
- 376 Halley Ave
- 376 Halley Ave Unit 376
- 378 Halley Ave
- 22 Poe Ct
- 163 Longfellow Ave
- 20 Poe Ct
- 46 Poe Ct