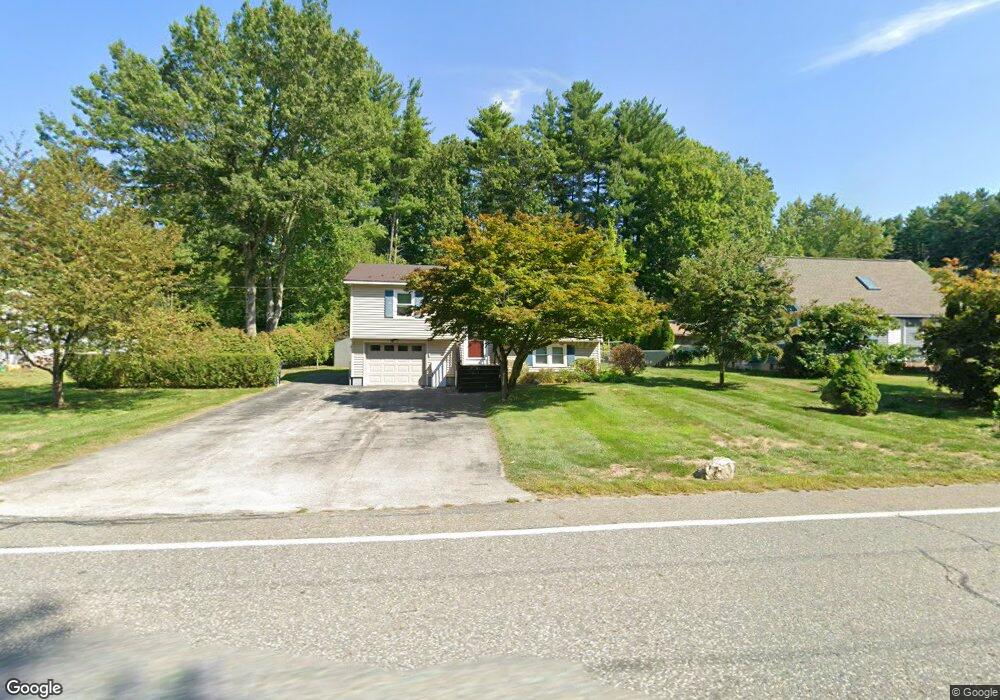
386 Main Dunstable Rd Nashua, NH 03062
Southwest Nashua NeighborhoodEstimated Value: $444,253 - $470,000
2
Beds
1
Bath
944
Sq Ft
$482/Sq Ft
Est. Value
About This Home
This home is located at 386 Main Dunstable Rd, Nashua, NH 03062 and is currently estimated at $455,313, approximately $482 per square foot. 386 Main Dunstable Rd is a home located in Hillsborough County with nearby schools including Main Dunstable School, Elm Street Middle School, and Nashua High School South.
Ownership History
Date
Name
Owned For
Owner Type
Purchase Details
Closed on
Dec 18, 2018
Sold by
Stonge Russell A and Stonge Susan A
Bought by
Stonge Ret and Stonge
Current Estimated Value
Purchase Details
Closed on
Sep 26, 2000
Sold by
Farr Stephen D and Farr Cynthia M
Bought by
St Onge Russell A and St Onge Susan A
Home Financials for this Owner
Home Financials are based on the most recent Mortgage that was taken out on this home.
Original Mortgage
$104,000
Interest Rate
8%
Mortgage Type
Purchase Money Mortgage
Create a Home Valuation Report for This Property
The Home Valuation Report is an in-depth analysis detailing your home's value as well as a comparison with similar homes in the area
Home Values in the Area
Average Home Value in this Area
Purchase History
| Date | Buyer | Sale Price | Title Company |
|---|---|---|---|
| Stonge Ret | -- | -- | |
| St Onge Russell A | $130,000 | -- |
Source: Public Records
Mortgage History
| Date | Status | Borrower | Loan Amount |
|---|---|---|---|
| Previous Owner | St Onge Russell A | $94,000 | |
| Previous Owner | St Onge Russell A | $104,000 |
Source: Public Records
Tax History Compared to Growth
Tax History
| Year | Tax Paid | Tax Assessment Tax Assessment Total Assessment is a certain percentage of the fair market value that is determined by local assessors to be the total taxable value of land and additions on the property. | Land | Improvement |
|---|---|---|---|---|
| 2024 | $6,242 | $392,600 | $166,700 | $225,900 |
| 2023 | $5,934 | $325,500 | $133,300 | $192,200 |
| 2022 | $5,882 | $325,500 | $133,300 | $192,200 |
| 2021 | $5,259 | $226,500 | $88,900 | $137,600 |
| 2020 | $5,121 | $226,500 | $88,900 | $137,600 |
| 2019 | $4,929 | $226,500 | $88,900 | $137,600 |
| 2018 | $4,793 | $226,000 | $88,900 | $137,100 |
| 2017 | $4,627 | $179,400 | $77,400 | $102,000 |
| 2016 | $4,470 | $178,300 | $77,400 | $100,900 |
| 2015 | $4,347 | $177,200 | $77,400 | $99,800 |
| 2014 | $4,262 | $177,200 | $77,400 | $99,800 |
Source: Public Records
Map
Nearby Homes
- 9 Michelle Dr
- 33 Valencia Dr Unit U33
- 25 Silverton Dr Unit U73
- 5 Wilderness Dr
- 19 Pioneer Dr
- 16 Laurel Ct Unit U320
- 25 Robinhood Rd
- 4 Heather Ct Unit U34
- 4 Henry David Dr Unit 203
- 4 Henry David Dr Unit 202
- 47 Dogwood Dr Unit U205
- 47 Dogwood Dr Unit U202
- 42 Woodfield St
- 4 Portchester Dr
- 12 Ledgewood Hills Dr Unit 105
- 12 Ledgewood Hills Dr Unit 302
- 288 Main Dunstable Rd
- 14 Millbrook Dr
- 40 Spring Cove Rd Unit U117
- 2 Wakefield Dr
- 388 Main Dunstable Rd
- 384 Main Dunstable Rd
- 390 Main Dunstable Rd
- 383 Main Dunstable Rd
- 27 Sagamore Rd
- 5 Trombly Terrace
- 3 Trombly Terrace
- 4 Penobscot Rd
- 6 Penobscot Rd
- 381 Main Dunstable Rd
- 30 Sagamore Rd
- 8 Penobscot Rd
- 25 Sagamore Rd
- 7 Trombly Terrace
- 10 Penobscot Rd
- 28 Sagamore Rd
- 379 Main Dunstable Rd
- 6 Trombly Terrace
- 26 Sagamore Rd
- 3 Penobscot Rd