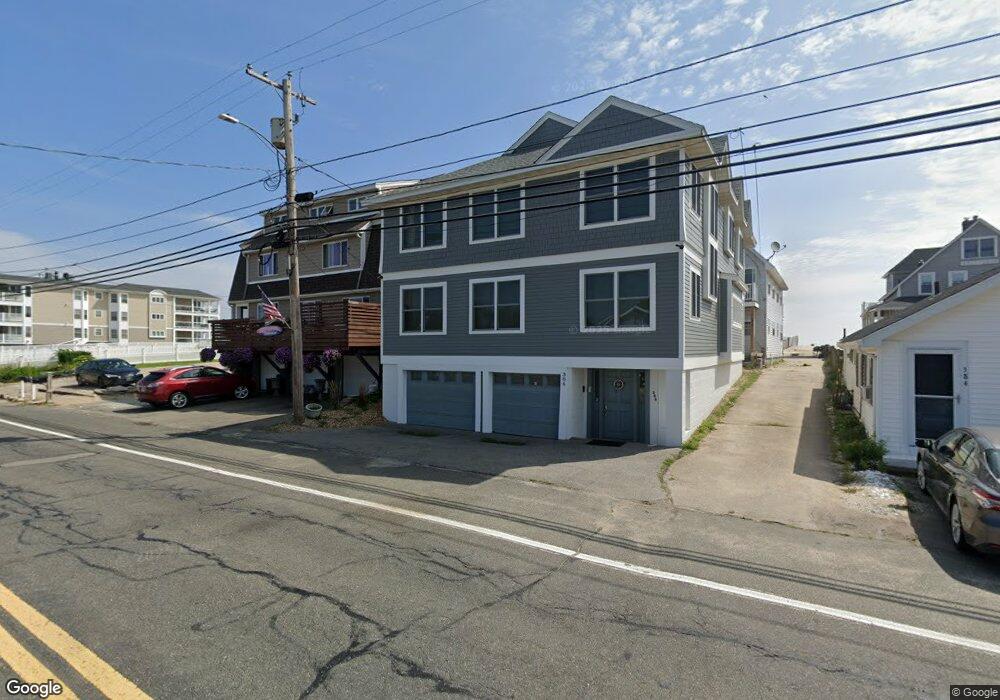
386 North End Blvd Salisbury, MA 01952
Estimated Value: $1,058,749 - $1,526,000
3
Beds
4
Baths
2,982
Sq Ft
$403/Sq Ft
Est. Value
About This Home
This home is located at 386 North End Blvd, Salisbury, MA 01952 and is currently estimated at $1,201,937, approximately $403 per square foot. 386 North End Blvd is a home with nearby schools including Triton Regional High School.
Ownership History
Date
Name
Owned For
Owner Type
Purchase Details
Closed on
Oct 2, 2025
Sold by
Nabhan Harold G
Bought by
Harold G Nabhan 2014 T G and Harold Nabhan
Current Estimated Value
Purchase Details
Closed on
May 21, 2015
Sold by
Cummings Dayna M
Bought by
Cummings Dayna M and Cummings Marisa
Purchase Details
Closed on
Mar 31, 2008
Sold by
Cummings Dayna M and Cummings Herbert M
Bought by
Cummings Dayna M
Purchase Details
Closed on
Mar 30, 2007
Sold by
Nabhan Harold G and Nabhan Violet Ann
Bought by
Nabhan Harold G and Nabhan Violet Ann
Home Financials for this Owner
Home Financials are based on the most recent Mortgage that was taken out on this home.
Original Mortgage
$358,600
Interest Rate
6.33%
Purchase Details
Closed on
Sep 4, 2003
Sold by
Barcelos Janice M and Barcelos John A
Bought by
Cummings Dayna M and Cummings Herbert M
Home Financials for this Owner
Home Financials are based on the most recent Mortgage that was taken out on this home.
Original Mortgage
$485,000
Interest Rate
6.02%
Mortgage Type
Purchase Money Mortgage
Purchase Details
Closed on
Jul 31, 1996
Sold by
Miamis Steven J
Bought by
Barcelos John A
Create a Home Valuation Report for This Property
The Home Valuation Report is an in-depth analysis detailing your home's value as well as a comparison with similar homes in the area
Home Values in the Area
Average Home Value in this Area
Purchase History
| Date | Buyer | Sale Price | Title Company |
|---|---|---|---|
| Harold G Nabhan 2014 T G | -- | -- | |
| Cummings Dayna M | -- | -- | |
| Cummings Dayna M | -- | -- | |
| Cummings Dayna M | -- | -- | |
| Nabhan Harold G | -- | -- | |
| Nabhan Harold G | -- | -- | |
| Cummings Dayna M | $635,000 | -- | |
| Barcelos John A | $205,000 | -- |
Source: Public Records
Mortgage History
| Date | Status | Borrower | Loan Amount |
|---|---|---|---|
| Previous Owner | Nabhan Harold G | $358,600 | |
| Previous Owner | Cummings Dayna M | $485,000 |
Source: Public Records
Tax History Compared to Growth
Tax History
| Year | Tax Paid | Tax Assessment Tax Assessment Total Assessment is a certain percentage of the fair market value that is determined by local assessors to be the total taxable value of land and additions on the property. | Land | Improvement |
|---|---|---|---|---|
| 2025 | $8,868 | $879,800 | $463,900 | $415,900 |
| 2024 | $8,794 | $841,500 | $463,900 | $377,600 |
| 2023 | $9,504 | $631,600 | $324,700 | $306,900 |
| 2022 | $9,369 | $631,600 | $324,700 | $306,900 |
| 2021 | $9,050 | $614,800 | $324,700 | $290,100 |
| 2020 | $7,049 | $615,100 | $324,700 | $290,400 |
| 2019 | $8,205 | $587,300 | $310,600 | $276,700 |
| 2018 | $7,360 | $589,500 | $310,600 | $278,900 |
| 2017 | $6,961 | $568,800 | $310,600 | $258,200 |
| 2016 | $6,289 | $538,900 | $279,500 | $259,400 |
| 2015 | $6,390 | $543,800 | $279,500 | $264,300 |
Source: Public Records
Map
Nearby Homes
- 432 N End Blvd
- 479 N End Blvd
- 492 N End Blvd
- 498 N End Blvd
- 10 Liberty St
- 522 N End Blvd
- 188 N End Blvd Unit 3
- 178 N End Blvd Unit A
- 178 N End Blvd Unit C
- 178 N End Blvd Unit F
- 595 N End Blvd Unit 2
- 168 N End Blvd
- 308 State Route 286 Unit Lot 73
- 308 State Route 286 Unit Lot 108
- 308 State Route 286 Unit Lot 87
- 308 Route 286 Unit 77
- 308 Route 286 Unit Lot 58
- 98 Central Ave
- 312 S Main St
- 38-40 Central Ave
- 392 N End Blvd
- 392 North End Blvd
- 388 N End Blvd
- 388 North End Blvd
- 394 North End Blvd
- 385 North End Blvd
- 387 North End Blvd
- 396 N End Blvd
- 398 N End Blvd
- 398 N End Blvd Unit B
- 387 N End Blvd
- 387 N End Blvd (1 Yr Lease) Unit 2
- 387 N End Blvd Unit 1
- 387 N End Blvd Unit 2
- 380 N End Blvd
- 391 North End Blvd
- 383 N End Blvd
- 378 North End Blvd
- 381 North End Blvd
- 381 N End Blvd