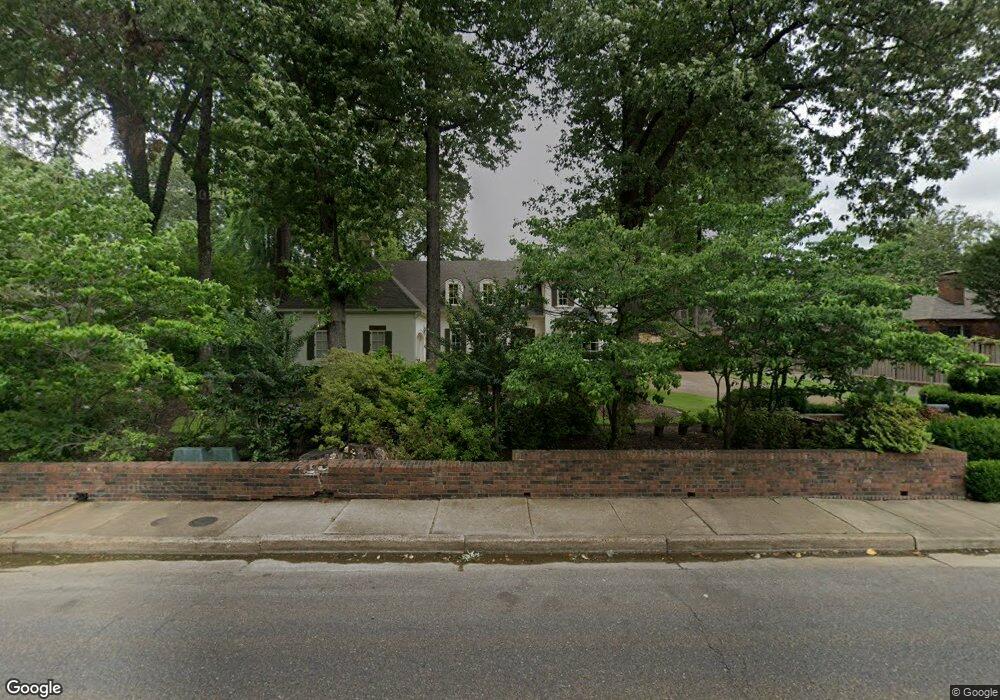
386 S Mendenhall Rd Memphis, TN 38117
Audubon Park NeighborhoodEstimated Value: $771,000 - $933,000
4
Beds
5
Baths
4,323
Sq Ft
$198/Sq Ft
Est. Value
About This Home
This home is located at 386 S Mendenhall Rd, Memphis, TN 38117 and is currently estimated at $856,347, approximately $198 per square foot. 386 S Mendenhall Rd is a home located in Shelby County with nearby schools including White Station Elementary School, White Station High, and White Station Middle.
Ownership History
Date
Name
Owned For
Owner Type
Purchase Details
Closed on
Dec 19, 2018
Sold by
Wigal Cole Robert J and Wigal Cole Floy
Bought by
Cole Floy Wigal
Current Estimated Value
Home Financials for this Owner
Home Financials are based on the most recent Mortgage that was taken out on this home.
Original Mortgage
$453,100
Outstanding Balance
$285,418
Interest Rate
4.7%
Mortgage Type
New Conventional
Estimated Equity
$570,929
Purchase Details
Closed on
Nov 7, 2018
Sold by
Cole Floy Wigal
Bought by
Cole Floy Wigal and Cole Robert J
Home Financials for this Owner
Home Financials are based on the most recent Mortgage that was taken out on this home.
Original Mortgage
$453,100
Outstanding Balance
$285,418
Interest Rate
4.7%
Mortgage Type
New Conventional
Estimated Equity
$570,929
Purchase Details
Closed on
Nov 10, 2015
Sold by
Cole R Jeff and Cole Robert Jeffrey
Bought by
Cole Floy Wigal
Purchase Details
Closed on
May 15, 1996
Sold by
Smith James M
Bought by
Cole R Jeff and Cole Floy Wigal
Home Financials for this Owner
Home Financials are based on the most recent Mortgage that was taken out on this home.
Original Mortgage
$460,000
Interest Rate
7.74%
Purchase Details
Closed on
Mar 29, 1995
Bought by
Boyd L Rhodes Jr Tr
Purchase Details
Closed on
Feb 16, 1995
Bought by
Tashie Paul S
Create a Home Valuation Report for This Property
The Home Valuation Report is an in-depth analysis detailing your home's value as well as a comparison with similar homes in the area
Home Values in the Area
Average Home Value in this Area
Purchase History
| Date | Buyer | Sale Price | Title Company |
|---|---|---|---|
| Cole Floy Wigal | -- | None Available | |
| Cole Floy Wigal | -- | None Available | |
| Cole Floy Wigal | -- | None Available | |
| Cole R Jeff | $460,000 | -- | |
| Boyd L Rhodes Jr Tr | $100,000 | -- | |
| Tashie Paul S | $75,000 | -- |
Source: Public Records
Mortgage History
| Date | Status | Borrower | Loan Amount |
|---|---|---|---|
| Open | Cole Floy Wigal | $453,100 | |
| Previous Owner | Cole R Jeff | $460,000 |
Source: Public Records
Tax History Compared to Growth
Tax History
| Year | Tax Paid | Tax Assessment Tax Assessment Total Assessment is a certain percentage of the fair market value that is determined by local assessors to be the total taxable value of land and additions on the property. | Land | Improvement |
|---|---|---|---|---|
| 2025 | $5,149 | $218,175 | $44,000 | $174,175 |
| 2024 | $5,149 | $151,875 | $34,425 | $117,450 |
| 2023 | $9,252 | $151,875 | $34,425 | $117,450 |
| 2022 | $9,252 | $151,875 | $34,425 | $117,450 |
| 2021 | $9,360 | $151,875 | $34,425 | $117,450 |
| 2020 | $10,452 | $144,250 | $34,425 | $109,825 |
| 2019 | $10,452 | $144,250 | $34,425 | $109,825 |
| 2018 | $10,452 | $144,250 | $34,425 | $109,825 |
| 2017 | $5,929 | $144,250 | $34,425 | $109,825 |
| 2016 | $6,129 | $140,250 | $0 | $0 |
| 2014 | $6,129 | $140,250 | $0 | $0 |
Source: Public Records
Map
Nearby Homes
- 5055 Greenway Rd
- 380 Greenway Place
- 4926 Greenway Ave
- 4916 Greenway Ave
- 4948 Fairfield Cir
- 5094 Cole Rd
- 4903 Greenway Ave
- 267 Barry Rd
- 435 Fairfield Cir
- 476 W Racquet Club Place
- 501 W Racquet Club Place
- 478 W Racquet Club Place
- 264 Barry Rd
- 5071 Anchor Cove
- 556 Saint Nick Dr
- 4859 Gwynne Rd
- 4821 Kingsgate Place S
- 5280 Cole Rd
- 356 Clove Dr
- 4736 All Spice Dr Unit 71E
- 398 S Mendenhall Rd
- 376 S Mendenhall Rd
- 376 S Mendenhall Rd
- 4997 Warwick Ave
- 4998 Warwick Ave
- 360 S Mendenhall Rd
- 5026 Greenway Ave
- 397 Greenway Rd
- 4994 Greenway Ave
- 383 Greenway Rd
- 4987 Warwick Ave
- 5001 Newhaven Ave
- 5000 Greenway Ave
- 363 Greenway Rd
- 4986 Warwick Ave
- 344 S Mendenhall Rd
- 407 Greenway Rd
- 4989 Newhaven Ave
- 4984 Greenway Ave
- 4977 Warwick Ave