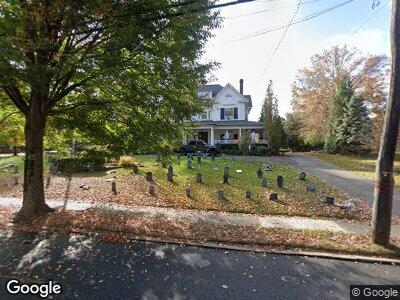
386 Spring Ave Ridgewood, NJ 07450
Estimated Value: $2,283,025 - $2,959,000
--
Bed
--
Bath
3,734
Sq Ft
$719/Sq Ft
Est. Value
About This Home
This home is located at 386 Spring Ave, Ridgewood, NJ 07450 and is currently estimated at $2,683,756, approximately $718 per square foot. 386 Spring Ave is a home located in Bergen County with nearby schools including Ridgewood High School, Little Crane Montessori School, and Holmstead School.
Ownership History
Date
Name
Owned For
Owner Type
Purchase Details
Closed on
Mar 23, 2017
Sold by
Leonard Robert L and Salick Gabriella
Bought by
Gabriella Salick Living Trust
Current Estimated Value
Home Financials for this Owner
Home Financials are based on the most recent Mortgage that was taken out on this home.
Original Mortgage
$1,690,000
Outstanding Balance
$241,027
Interest Rate
2.04%
Mortgage Type
Stand Alone Refi Refinance Of Original Loan
Estimated Equity
$2,357,511
Purchase Details
Closed on
Aug 3, 2015
Sold by
Giordano Frank and Giordano Kate
Bought by
Leonard Robert L
Purchase Details
Closed on
Jul 30, 1998
Sold by
Ahearn James F and Ahearn Mary Ann
Bought by
Giordano Frank and Giordano Kate
Home Financials for this Owner
Home Financials are based on the most recent Mortgage that was taken out on this home.
Original Mortgage
$564,000
Interest Rate
6.92%
Create a Home Valuation Report for This Property
The Home Valuation Report is an in-depth analysis detailing your home's value as well as a comparison with similar homes in the area
Home Values in the Area
Average Home Value in this Area
Purchase History
| Date | Buyer | Sale Price | Title Company |
|---|---|---|---|
| Gabriella Salick Living Trust | -- | Westcor Land Title | |
| Leonard Robert L | $1,690,000 | Attorney | |
| Giordano Frank | $705,000 | -- |
Source: Public Records
Mortgage History
| Date | Status | Borrower | Loan Amount |
|---|---|---|---|
| Open | Salick Gabriella | $1,690,000 | |
| Previous Owner | Giordano Frank | $675,000 | |
| Previous Owner | Giordano Francis J | $200,000 | |
| Previous Owner | Giordano Frank | $564,000 |
Source: Public Records
Tax History Compared to Growth
Tax History
| Year | Tax Paid | Tax Assessment Tax Assessment Total Assessment is a certain percentage of the fair market value that is determined by local assessors to be the total taxable value of land and additions on the property. | Land | Improvement |
|---|---|---|---|---|
| 2024 | $41,892 | $1,494,000 | $623,500 | $870,500 |
| 2023 | $40,287 | $1,494,000 | $623,500 | $870,500 |
| 2022 | $40,287 | $1,474,100 | $623,500 | $850,600 |
| 2021 | $39,919 | $1,474,100 | $623,500 | $850,600 |
| 2020 | $38,872 | $1,474,100 | $623,500 | $850,600 |
| 2019 | $38,282 | $1,474,100 | $623,500 | $850,600 |
| 2018 | $37,811 | $1,474,100 | $623,500 | $850,600 |
| 2017 | $37,413 | $1,474,100 | $623,500 | $850,600 |
| 2016 | $36,499 | $1,474,100 | $623,500 | $850,600 |
| 2015 | $35,865 | $1,474,100 | $623,500 | $850,600 |
| 2014 | $35,157 | $1,474,100 | $623,500 | $850,600 |
Source: Public Records
Map
Nearby Homes
- 153 Hope St
- 37 Kira Ln
- 364 E Ridgewood Ave Unit 8
- 348 Prospect St
- 319 S Maple Ave
- 133 Foster Terrace
- 318 Willow Ct
- 69 Midwood Rd
- 31 Reynen Ct
- 777 E Ridgewood Ave
- 32 Brainard Place
- 435 Overbrook Rd
- 412 S Maple Ave
- 104 Hampton Place
- 222 S Broad St Unit 16
- 16 Highwood Terrace
- 117 Dean St
- 145 Midwood Rd
- 611 Albert Place
- 31 Ethelbert Place
- 386 Spring Ave
- 216 S Irving St
- 370 Spring Ave
- 224 S Irving St
- 405 Spring Ave
- 385 Gilbert St
- 385 Gilbert St Unit 2
- 389 Spring Ave Unit A
- 389 Spring Ave
- 389 Spring Ave Unit C
- 389 Spring Ave Unit B
- 389 Spring Ave Unit 3
- 389 Spring Ave Unit 2
- 389 Spring Ave Unit 2nd.floor
- 381 Gilbert St
- 381 Gilbert St Unit 2
- 381 Spring Ave
- 375 Gilbert St
- 375 Spring Ave