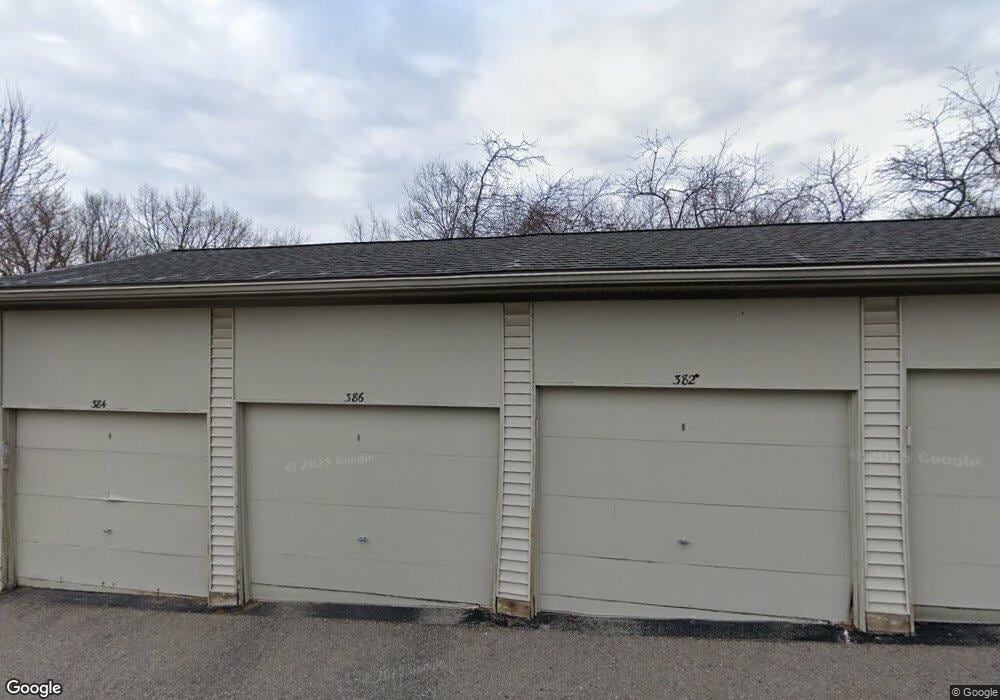
386 Spring Brooke Dr Unit 42 Brighton, MI 48116
Estimated Value: $172,000 - $180,000
1
Bed
1
Bath
780
Sq Ft
$224/Sq Ft
Est. Value
About This Home
This home is located at 386 Spring Brooke Dr Unit 42, Brighton, MI 48116 and is currently estimated at $174,520, approximately $223 per square foot. 386 Spring Brooke Dr Unit 42 is a home located in Livingston County with nearby schools including Hilton Road Elementary School, Scranton Middle School, and Brighton High School.
Ownership History
Date
Name
Owned For
Owner Type
Purchase Details
Closed on
Sep 16, 2013
Sold by
Jannon Candice A and Jannon Candice
Bought by
Russell Charles E and Russell Pamela E
Current Estimated Value
Purchase Details
Closed on
May 12, 2004
Sold by
Twork Nicholas
Bought by
Nichols Randal R
Purchase Details
Closed on
Jan 31, 2002
Sold by
Dryer Anthony J and Dryer Dana C
Bought by
Twork Nicholas
Purchase Details
Closed on
Oct 31, 2000
Sold by
Mitchell Carol J
Bought by
Dryer Anthony J and Dryer Dana C
Purchase Details
Closed on
Dec 18, 1998
Sold by
Dryer Anthony J and Dryer Dana C
Bought by
Mitchell Carol J
Purchase Details
Closed on
Apr 13, 1995
Sold by
Ford Christopher R
Bought by
Dryer Anthony J and Dryer Knebl C
Home Financials for this Owner
Home Financials are based on the most recent Mortgage that was taken out on this home.
Original Mortgage
$55,575
Interest Rate
8.42%
Mortgage Type
New Conventional
Create a Home Valuation Report for This Property
The Home Valuation Report is an in-depth analysis detailing your home's value as well as a comparison with similar homes in the area
Home Values in the Area
Average Home Value in this Area
Purchase History
| Date | Buyer | Sale Price | Title Company |
|---|---|---|---|
| Russell Charles E | $50,000 | -- | |
| Nichols Randal R | $106,575 | Landmark Title Services | |
| Twork Nicholas | $105,000 | Select Title | |
| Dryer Anthony J | $89,000 | Select Title Company | |
| Mitchell Carol J | $85,000 | Metropolitan Title Company | |
| Dryer Anthony J | $58,500 | -- |
Source: Public Records
Mortgage History
| Date | Status | Borrower | Loan Amount |
|---|---|---|---|
| Previous Owner | Dryer Anthony J | $55,575 |
Source: Public Records
Tax History Compared to Growth
Tax History
| Year | Tax Paid | Tax Assessment Tax Assessment Total Assessment is a certain percentage of the fair market value that is determined by local assessors to be the total taxable value of land and additions on the property. | Land | Improvement |
|---|---|---|---|---|
| 2025 | $1,616 | $81,300 | $0 | $0 |
| 2024 | $1,249 | $72,200 | $0 | $0 |
| 2023 | $1,189 | $62,900 | $0 | $0 |
| 2022 | $1,487 | $50,100 | $0 | $0 |
| 2021 | $1,459 | $58,100 | $0 | $0 |
| 2020 | $1,451 | $57,400 | $0 | $0 |
| 2019 | $1,438 | $50,100 | $0 | $0 |
| 2018 | $1,293 | $41,600 | $0 | $0 |
| 2017 | $1,268 | $42,500 | $0 | $0 |
| 2016 | $1,259 | $35,700 | $0 | $0 |
| 2014 | $1,364 | $31,610 | $0 | $0 |
| 2012 | $1,364 | $35,800 | $0 | $0 |
Source: Public Records
Map
Nearby Homes
- 396 Spring Brooke Dr Unit 49
- 390 Spring Brooke Dr Unit 390
- 399 Spring Brooke Dr
- 413 Water Tower Cir Unit 97
- 312 Spring Brooke Dr
- 1016 Pinewood Ct Unit 48
- 1025 Pinewood Ct Unit 30
- 392 Woodfield Square Ln
- 816 Maplewood Ct
- 840 Woodridge Hills Dr
- 1048 Pinewood Ct Unit 40
- 860 Woodridge Hills Dr Unit 95
- 326 Redmaple Ln Unit 65
- 1242 Baywood Cir
- 1041 Fairway Trails Dr
- 978 Oak Ridge Cir
- 171 Kissane Ave
- 1075 Long Leaf Ct Unit 9
- 1324 Peppergrove Dr
- 935 Mildred J Ct Unit 30
- 386 Spring Brooke Dr Unit 12
- 382 Spring Brooke Dr Unit 44
- 85 Carston Ln
- 384 Spring Brooke Dr
- 378 Spring Brooke Dr Unit 40
- 380 Spring Brooke Dr Unit Bldg-Unit
- 380 Spring Brooke Dr
- 376 Spring Brooke Dr
- 39 Carston Ln
- 392 Spring Brooke Dr Unit 47
- 392 Spring Brooke Dr Unit 11, 47
- 388 Spring Brooke Dr
- 390 Spring Brooke Dr Unit 46
- 390 Spring Brooke Dr Unit 11, 46
- 398 Spring Brooke Dr Unit 48
- 398 Spring Brooke Dr Unit 11 48
- 374 Spring Brooke Dr
- 394 Spring Brooke Dr Unit 50
- 370 Spring Brooke Dr
- 38 Carston Ln