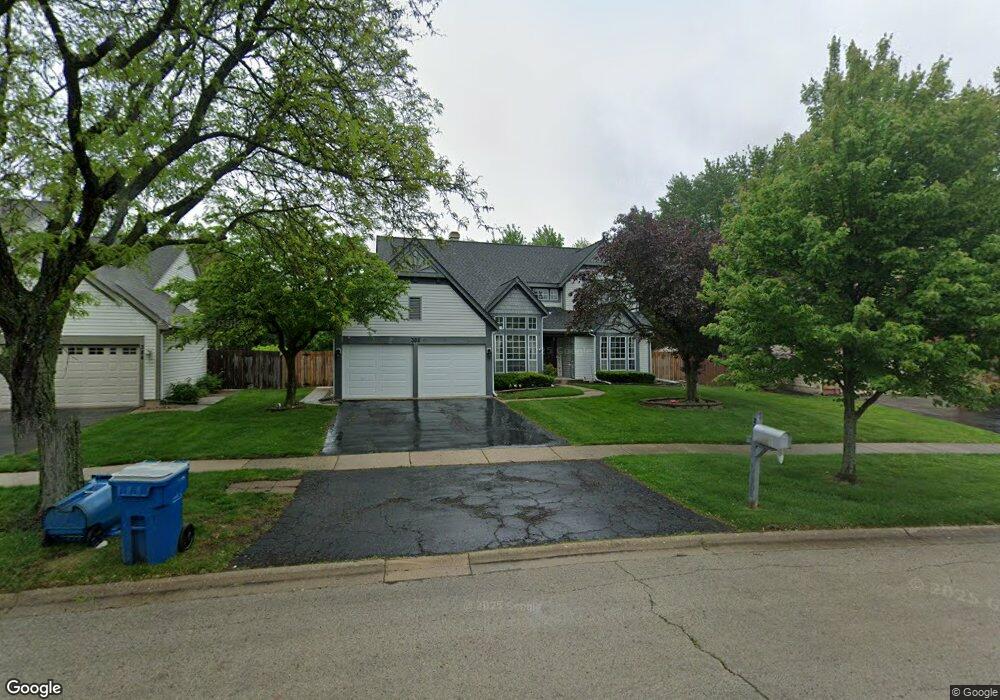
386 Wildberry Ln Bartlett, IL 60103
South Tri Village NeighborhoodEstimated Value: $567,842 - $665,000
4
Beds
4
Baths
2,705
Sq Ft
$224/Sq Ft
Est. Value
About This Home
This home is located at 386 Wildberry Ln, Bartlett, IL 60103 and is currently estimated at $605,461, approximately $223 per square foot. 386 Wildberry Ln is a home located in DuPage County with nearby schools including Prairieview Elementary School, Eastview Middle School, and Bartlett High School.
Ownership History
Date
Name
Owned For
Owner Type
Purchase Details
Closed on
Jul 10, 2017
Sold by
Dempsey John and Dempsey Lisa
Bought by
Patel Ankur and Patel Alpa
Current Estimated Value
Home Financials for this Owner
Home Financials are based on the most recent Mortgage that was taken out on this home.
Original Mortgage
$292,700
Outstanding Balance
$243,518
Interest Rate
3.94%
Mortgage Type
New Conventional
Estimated Equity
$361,943
Purchase Details
Closed on
May 25, 2004
Sold by
Bull Fred and Bull Teresa M
Bought by
Dempsey John and Dempsey Lisa
Purchase Details
Closed on
Nov 29, 2000
Sold by
Dieschbourg Matthew R and Dieschbourg Heather R
Bought by
Bull Fred and Bull Teresa M
Home Financials for this Owner
Home Financials are based on the most recent Mortgage that was taken out on this home.
Original Mortgage
$200,000
Interest Rate
7.8%
Purchase Details
Closed on
Nov 18, 1999
Sold by
Hill Ronald K and Hill Carol L
Bought by
Dieschbourg Matthew R and Dieschbourg Heather R
Home Financials for this Owner
Home Financials are based on the most recent Mortgage that was taken out on this home.
Original Mortgage
$261,000
Interest Rate
7.55%
Create a Home Valuation Report for This Property
The Home Valuation Report is an in-depth analysis detailing your home's value as well as a comparison with similar homes in the area
Home Values in the Area
Average Home Value in this Area
Purchase History
| Date | Buyer | Sale Price | Title Company |
|---|---|---|---|
| Patel Ankur | $366,000 | Chicago Title Company | |
| Dempsey John | $370,000 | Fat | |
| Bull Fred | $320,000 | -- | |
| Dieschbourg Matthew R | $290,000 | -- |
Source: Public Records
Mortgage History
| Date | Status | Borrower | Loan Amount |
|---|---|---|---|
| Open | Patel Ankur | $292,700 | |
| Previous Owner | Bull Fred | $200,000 | |
| Previous Owner | Dieschbourg Matthew R | $261,000 | |
| Closed | Dieschbourg Matthew R | $20,000 |
Source: Public Records
Tax History
| Year | Tax Paid | Tax Assessment Tax Assessment Total Assessment is a certain percentage of the fair market value that is determined by local assessors to be the total taxable value of land and additions on the property. | Land | Improvement |
|---|---|---|---|---|
| 2024 | $12,467 | $162,189 | $35,469 | $126,720 |
| 2023 | $11,832 | $151,570 | $32,180 | $119,390 |
| 2022 | $11,312 | $135,450 | $28,760 | $106,690 |
| 2021 | $10,995 | $128,580 | $27,300 | $101,280 |
| 2020 | $10,733 | $124,720 | $26,480 | $98,240 |
| 2019 | $11,241 | $127,260 | $27,750 | $99,510 |
| 2018 | $11,070 | $121,770 | $26,550 | $95,220 |
| 2017 | $10,762 | $116,920 | $25,490 | $91,430 |
| 2016 | $10,561 | $111,680 | $24,350 | $87,330 |
| 2015 | $10,549 | $105,720 | $23,050 | $82,670 |
| 2014 | $9,987 | $104,730 | $24,160 | $80,570 |
| 2013 | $11,980 | $107,240 | $24,740 | $82,500 |
Source: Public Records
Map
Nearby Homes
- 2325 Bayside Dr
- 1643 Colfax Ct Unit 4
- 1619 Camberley Ct Unit 2
- 1632 Columbia Cir Unit 4
- 1516 Trenton Ln
- 422 Cromwell Cir Unit 2
- 403 Cromwell Cir Unit 2
- 2198 Wildwood Ln
- 272 Village Ln
- 1480 Harmony Dr
- 1901 Pastoral Ln
- 264 Norway Ct
- 1354 Branden Ct
- 1811 Rizzi Ln
- 1874 Windward Ln
- 1297 Woodlake Dr Unit 1
- 1308 Coldspring Rd Unit 7
- 1328 Big Horn Trail
- 1266 Seabury Cir
- 1793 Goddard Ln
- 384 Wildberry Ln
- 388 Wildberry Ln
- 380 Wildberry Ln
- 4320 Bayside Dr
- 390 Wildberry Ln
- 387 Wildberry Ln
- 383 Wildberry Ln
- 376 Wildberry Ln
- 392 Wildberry Ln
- 391 Wildberry Ln
- 4310 Bayside Dr
- 2380 Bayside Dr
- 372 Wildberry Ln
- 4300 Bayside Dr Unit 4
- 394 Wildberry Ln
- 357 Sparrow Ln
- 2370 Bayside Dr
- 4290 Bayside Dr
- 368 Wildberry Ln
- 355 Sparrow Ln
Your Personal Tour Guide
Ask me questions while you tour the home.