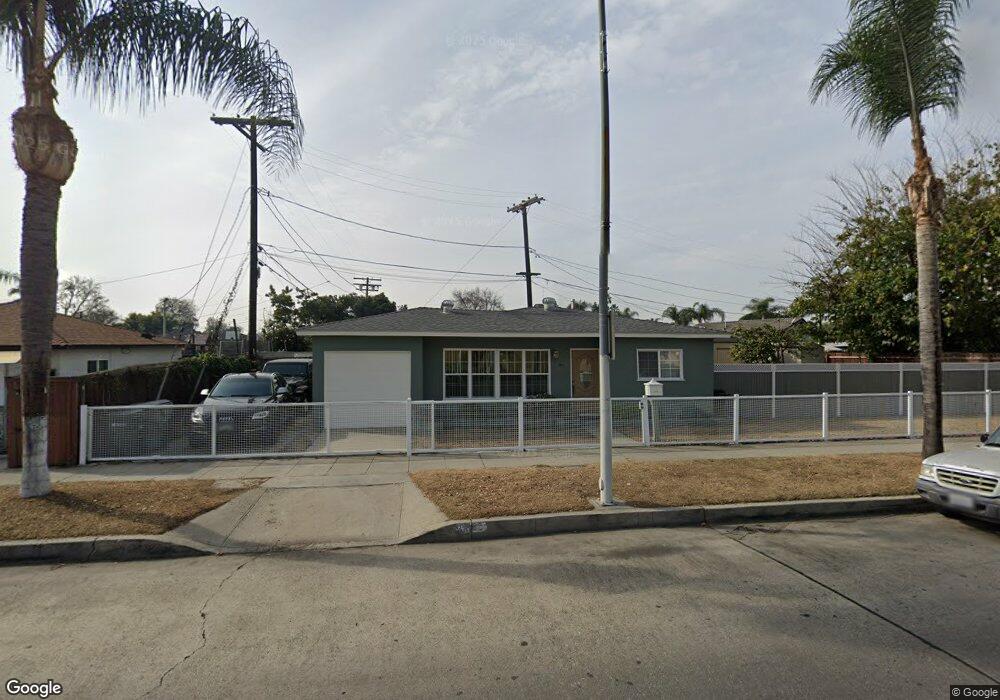
3860 Mlk jr Blvd Lynwood, CA 90262
Estimated Value: $608,391 - $711,000
2
Beds
1
Bath
804
Sq Ft
$824/Sq Ft
Est. Value
About This Home
This home is located at 3860 Mlk jr Blvd, Lynwood, CA 90262 and is currently estimated at $662,098, approximately $823 per square foot. 3860 Mlk jr Blvd is a home located in Los Angeles County with nearby schools including Washington Elementary School, Hosler Middle School, and Lynwood High School.
Ownership History
Date
Name
Owned For
Owner Type
Purchase Details
Closed on
Jan 20, 2010
Sold by
Salazar Jose R and Salazar Ana B
Bought by
Salazar Jose R
Current Estimated Value
Home Financials for this Owner
Home Financials are based on the most recent Mortgage that was taken out on this home.
Original Mortgage
$142,000
Interest Rate
4.99%
Mortgage Type
New Conventional
Purchase Details
Closed on
Nov 27, 2009
Sold by
Salazar Jose R and Salazar Ana B
Bought by
Salazar Jose R
Home Financials for this Owner
Home Financials are based on the most recent Mortgage that was taken out on this home.
Original Mortgage
$142,000
Interest Rate
4.99%
Mortgage Type
New Conventional
Purchase Details
Closed on
Mar 6, 2002
Sold by
Salazar Jose Roberto and Salazar Ana
Bought by
Salazar Jose R
Purchase Details
Closed on
Aug 22, 2001
Sold by
Salazar Jose Roberto and Salazar Ana
Bought by
Salazar Jose Roberto
Home Financials for this Owner
Home Financials are based on the most recent Mortgage that was taken out on this home.
Original Mortgage
$98,000
Interest Rate
7%
Create a Home Valuation Report for This Property
The Home Valuation Report is an in-depth analysis detailing your home's value as well as a comparison with similar homes in the area
Home Values in the Area
Average Home Value in this Area
Purchase History
| Date | Buyer | Sale Price | Title Company |
|---|---|---|---|
| Salazar Jose R | -- | None Available | |
| Salazar Jose R | -- | Servicelink | |
| Salazar Jose R | -- | -- | |
| Salazar Jose Roberto | -- | Stewart Title Company |
Source: Public Records
Mortgage History
| Date | Status | Borrower | Loan Amount |
|---|---|---|---|
| Closed | Salazar Jose R | $142,000 | |
| Closed | Salazar Jose Roberto | $98,000 |
Source: Public Records
Tax History Compared to Growth
Tax History
| Year | Tax Paid | Tax Assessment Tax Assessment Total Assessment is a certain percentage of the fair market value that is determined by local assessors to be the total taxable value of land and additions on the property. | Land | Improvement |
|---|---|---|---|---|
| 2025 | $3,940 | $248,947 | $174,403 | $74,544 |
| 2024 | $3,940 | $244,067 | $170,984 | $73,083 |
| 2023 | $3,841 | $234,012 | $167,632 | $66,380 |
| 2022 | $3,715 | $229,425 | $164,346 | $65,079 |
| 2021 | $3,592 | $224,927 | $161,124 | $63,803 |
| 2019 | $3,663 | $218,257 | $156,346 | $61,911 |
| 2018 | $3,387 | $213,979 | $153,281 | $60,698 |
| 2016 | $3,178 | $205,672 | $147,330 | $58,342 |
| 2015 | $3,120 | $202,583 | $145,117 | $57,466 |
| 2014 | $3,058 | $198,616 | $142,275 | $56,341 |
Source: Public Records
Map
Nearby Homes
- 11309 Annetta Ave
- 11267 Sampson Ave
- 3831 Walnut Ave
- 4000 Platt Ave
- 3805 Lugo Ave
- 4032 Le Sage St
- 3886 Cortland St
- 3644 Platt Ave
- 3685 Fernwood Ave
- 10891 Standard Ave
- 10933 Sampson Ave
- 4245 Lugo Ave
- 4296 Platt Ave
- 4274 Walnut Ave
- 11460 Copeland St
- 11464 Copeland St
- 4296 Walnut Ave
- 11363 Virginia Ave
- 3955 Agnes Ave
- 10611 San Luis Ave
- 11308 Ernestine Ave
- 11300 Ernestine Ave
- 11316 Ernestine Ave
- 11301 Hulme Ave
- 11309 Hulme Ave
- 11315 Hulme Ave
- 11324 Ernestine Ave
- 3875 Mlk jr Blvd
- 3867 Mlk jr Blvd
- 3883 Mlk jr Blvd
- 11323 Hulme Ave
- 3859 Mlk jr Blvd
- 11332 Ernestine Ave
- 3891 Mlk jr Blvd
- 3851 Mlk jr Blvd
- 11331 Hulme Ave
- 11300 Hulme Ave
- 11340 Ernestine Ave
- 11310 Hulme Ave
- 3837 Martin Luther King Dr