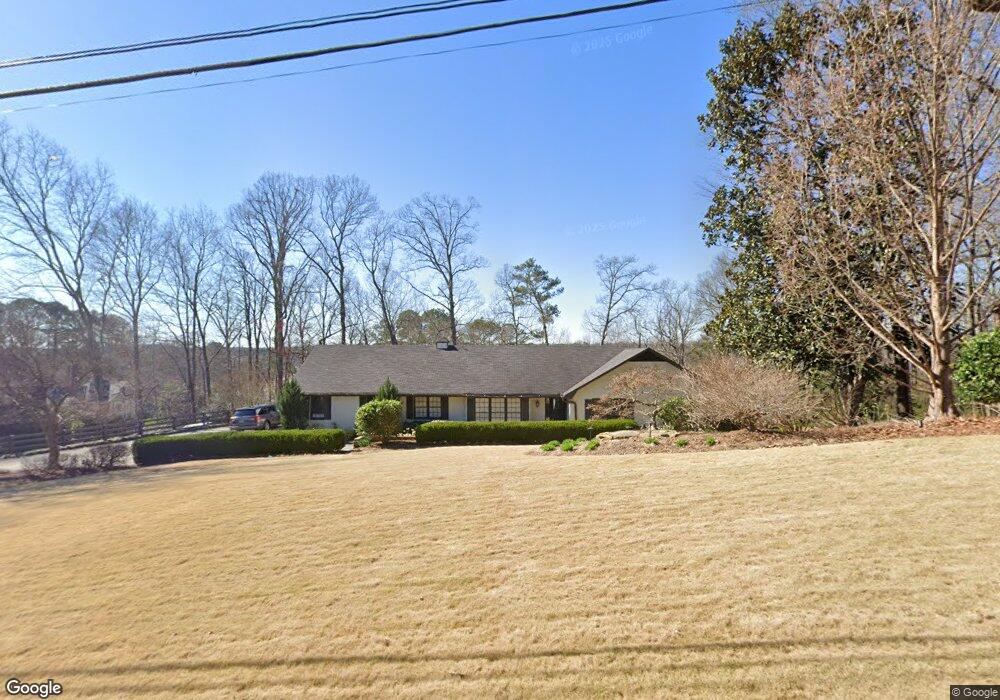
3860 Ridge Rd SE Smyrna, GA 30080
Estimated Value: $697,092 - $770,000
3
Beds
2
Baths
2,014
Sq Ft
$363/Sq Ft
Est. Value
About This Home
This home is located at 3860 Ridge Rd SE, Smyrna, GA 30080 and is currently estimated at $730,273, approximately $362 per square foot. 3860 Ridge Rd SE is a home located in Cobb County with nearby schools including Nickajack Elementary School, Griffin Middle School, and Campbell High School.
Ownership History
Date
Name
Owned For
Owner Type
Purchase Details
Closed on
Nov 4, 2021
Sold by
Alan Anderson
Bought by
Anderson Alan and Anderson Mallory Collins
Current Estimated Value
Home Financials for this Owner
Home Financials are based on the most recent Mortgage that was taken out on this home.
Original Mortgage
$547,200
Outstanding Balance
$500,785
Interest Rate
3.05%
Mortgage Type
New Conventional
Estimated Equity
$229,488
Purchase Details
Closed on
Feb 22, 2011
Sold by
Greeson Aileen J
Bought by
Combs Christopher M and Combs Darlene G
Home Financials for this Owner
Home Financials are based on the most recent Mortgage that was taken out on this home.
Original Mortgage
$165,000
Interest Rate
4.76%
Mortgage Type
Trade
Create a Home Valuation Report for This Property
The Home Valuation Report is an in-depth analysis detailing your home's value as well as a comparison with similar homes in the area
Home Values in the Area
Average Home Value in this Area
Purchase History
| Date | Buyer | Sale Price | Title Company |
|---|---|---|---|
| Anderson Alan | -- | Bagwell & Associates Pc | |
| Anderson Alan | $608,000 | Bagwell & Associates Pc | |
| Combs Christopher M | $185,000 | -- |
Source: Public Records
Mortgage History
| Date | Status | Borrower | Loan Amount |
|---|---|---|---|
| Open | Anderson Alan | $547,200 | |
| Previous Owner | Combs Christopher M | $165,000 |
Source: Public Records
Tax History Compared to Growth
Tax History
| Year | Tax Paid | Tax Assessment Tax Assessment Total Assessment is a certain percentage of the fair market value that is determined by local assessors to be the total taxable value of land and additions on the property. | Land | Improvement |
|---|---|---|---|---|
| 2025 | $6,762 | $248,952 | $38,000 | $210,952 |
| 2024 | $6,605 | $243,200 | $29,320 | $213,880 |
| 2023 | $6,605 | $243,200 | $29,320 | $213,880 |
| 2022 | $6,654 | $243,200 | $29,320 | $213,880 |
| 2021 | $3,322 | $120,836 | $30,000 | $90,836 |
| 2020 | $3,322 | $120,836 | $30,000 | $90,836 |
| 2019 | $3,322 | $120,836 | $30,000 | $90,836 |
| 2018 | $2,759 | $100,368 | $30,000 | $70,368 |
| 2017 | $2,589 | $100,368 | $30,000 | $70,368 |
| 2016 | $2,588 | $100,368 | $30,000 | $70,368 |
| 2015 | $1,953 | $73,984 | $25,344 | $48,640 |
| 2014 | $1,972 | $73,984 | $0 | $0 |
Source: Public Records
Map
Nearby Homes
- 4051 Ridgehurst Dr SE
- 3851 Glenhurst Dr SE
- 4059 Vinings Mill Trail SE
- 4060 Laurel Ridge Trail SE
- 0 Church St Unit 10397761
- 0 Church St Unit 7473410
- 2207 Iron Gate Dr SE
- 3755 Ashwood Dr SE
- 3412 Archerfield Way
- 3605 Hickory Cir SE
- 1477 Spruce Dr SE
- 4201 Charleston Trail SE
- 2027 Cooper Lake Dr SE
- 1914 Cooper Landing Dr SE
- 1910 Cooper Landing Dr SE
- 1982 Cheyanne Dr SE
- 3485 Navaho Trail SE
- 3840 Ridge Rd SE
- 3880 Ridge Rd SE
- 4001 Ridgehurst Dr SE
- 3990 Glenhurst Dr SE
- 3920 Glenhurst Dr SE
- 3910 Glenhurst Dr SE
- 4011 Ridgehurst Dr SE
- 3810 Ridge Rd SE
- 3930 Glenhurst Dr SE
- 3980 Glenhurst Dr SE
- 3900 Glenhurst Dr SE
- 4021 Ridgehurst Dr SE
- 3991 Glenhurst Dr SE
- 3940 Glenhurst Dr SE
- 1931 Tyler Ridge SE
- 1921 Tyler Ridge SE
- 3890 Glenhurst Dr SE
- 3970 Glenhurst Dr SE
- 4000 Ridgehurst Dr SE
- 3995 Glenhurst Dr SE