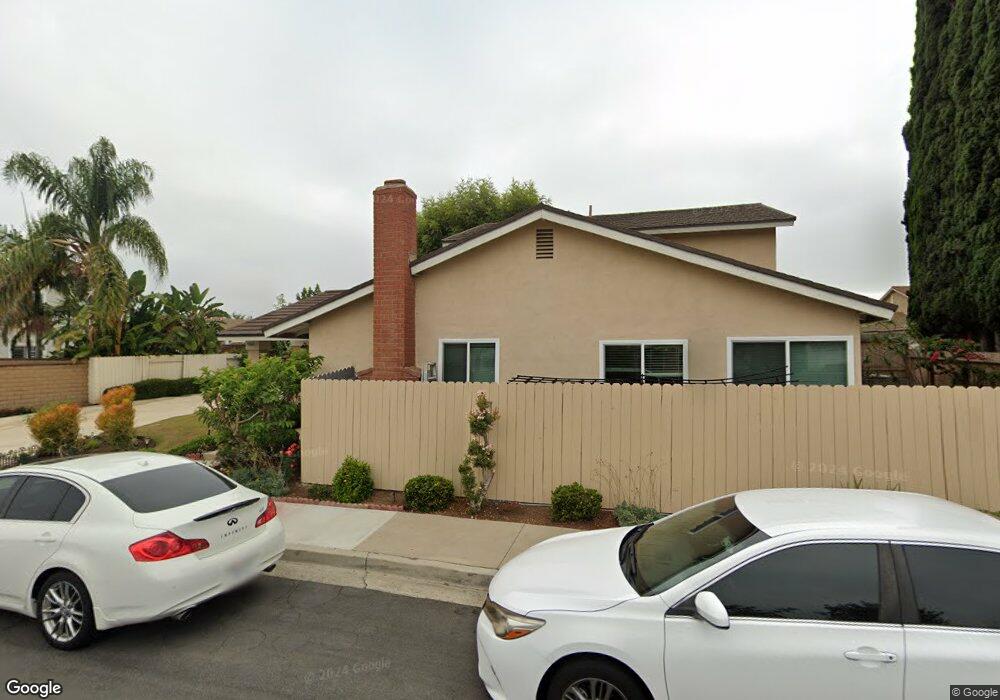
3861 Faulkner Ct Irvine, CA 92606
Walnut NeighborhoodEstimated Value: $1,446,227 - $1,745,000
5
Beds
3
Baths
1,929
Sq Ft
$841/Sq Ft
Est. Value
About This Home
This home is located at 3861 Faulkner Ct, Irvine, CA 92606 and is currently estimated at $1,622,807, approximately $841 per square foot. 3861 Faulkner Ct is a home located in Orange County with nearby schools including College Park Elementary School, Venado Middle School, and Irvine High School.
Ownership History
Date
Name
Owned For
Owner Type
Purchase Details
Closed on
May 24, 1995
Sold by
Combine Bradley A and Beach Teri L
Bought by
Ho Ping Shing
Current Estimated Value
Home Financials for this Owner
Home Financials are based on the most recent Mortgage that was taken out on this home.
Original Mortgage
$88,500
Interest Rate
7.88%
Purchase Details
Closed on
Nov 26, 1993
Sold by
Viola Sue E
Bought by
Combine Bradley A and Beach Teri L
Home Financials for this Owner
Home Financials are based on the most recent Mortgage that was taken out on this home.
Original Mortgage
$217,000
Interest Rate
5.12%
Purchase Details
Closed on
Feb 8, 1993
Sold by
Dorsey Douglas Jackson
Bought by
Beach Teri Lynn
Create a Home Valuation Report for This Property
The Home Valuation Report is an in-depth analysis detailing your home's value as well as a comparison with similar homes in the area
Home Values in the Area
Average Home Value in this Area
Purchase History
| Date | Buyer | Sale Price | Title Company |
|---|---|---|---|
| Ho Ping Shing | $238,500 | Fidelity National Title Ins | |
| Combine Bradley A | -- | Guardian Title Company | |
| Beach Teri Lynn | -- | Guardian Title Company | |
| Beach Teri Lynn | -- | Guardian Title Company |
Source: Public Records
Mortgage History
| Date | Status | Borrower | Loan Amount |
|---|---|---|---|
| Closed | Ho Ping Shing | $88,500 | |
| Previous Owner | Combine Bradley A | $217,000 |
Source: Public Records
Tax History Compared to Growth
Tax History
| Year | Tax Paid | Tax Assessment Tax Assessment Total Assessment is a certain percentage of the fair market value that is determined by local assessors to be the total taxable value of land and additions on the property. | Land | Improvement |
|---|---|---|---|---|
| 2025 | $4,169 | $396,198 | $242,256 | $153,942 |
| 2024 | $4,169 | $388,430 | $237,506 | $150,924 |
| 2023 | $4,060 | $380,814 | $232,849 | $147,965 |
| 2022 | $3,978 | $373,348 | $228,284 | $145,064 |
| 2021 | $3,883 | $366,028 | $223,808 | $142,220 |
| 2020 | $3,861 | $362,275 | $221,513 | $140,762 |
| 2019 | $3,774 | $355,172 | $217,170 | $138,002 |
| 2018 | $3,705 | $348,208 | $212,911 | $135,297 |
| 2017 | $3,627 | $341,381 | $208,736 | $132,645 |
| 2016 | $3,468 | $334,688 | $204,643 | $130,045 |
| 2015 | $3,363 | $329,661 | $201,569 | $128,092 |
| 2014 | $3,297 | $323,204 | $197,621 | $125,583 |
Source: Public Records
Map
Nearby Homes
- 3852 Uris Ct
- 14375 Majorca Ave
- 14172 Moore Ct
- 14561 Linden Ave
- 4071 Loma St
- 3871 Banyan St
- 20 Nevada
- 46 Nebraska
- 3621 Myrtle St
- 3852 Blackthorn St
- 16 Arizona
- 54 Night Bloom
- 43 Riverstone
- 424 Deerfield Ave Unit 172
- 32 Goldenbush
- 11 Burke
- 4 Wintergreen Unit 4
- 264 Blue Sky Dr Unit 264
- 369 Deerfield Ave Unit 35
- 311 Nimbus Dr
- 3871 Faulkner Ct
- 3862 Uris Ct
- 14442 Majorca Ave
- 14452 Majorca Ave
- 3842 Uris Ct
- 3881 Faulkner Ct
- 3872 Uris Ct
- 3832 Uris Ct
- 3852 Faulkner Ct
- 3862 Faulkner Ct
- 3842 Faulkner Ct
- 3872 Faulkner Ct
- 3882 Faulkner Ct
- 3881 Uris Ct
- 3812 Provincetown Ave
- 3871 Uris Ct
- 14402 Majorca Ave
- 3832 Faulkner Ct
- 3861 Uris Ct
- 3851 Uris Ct