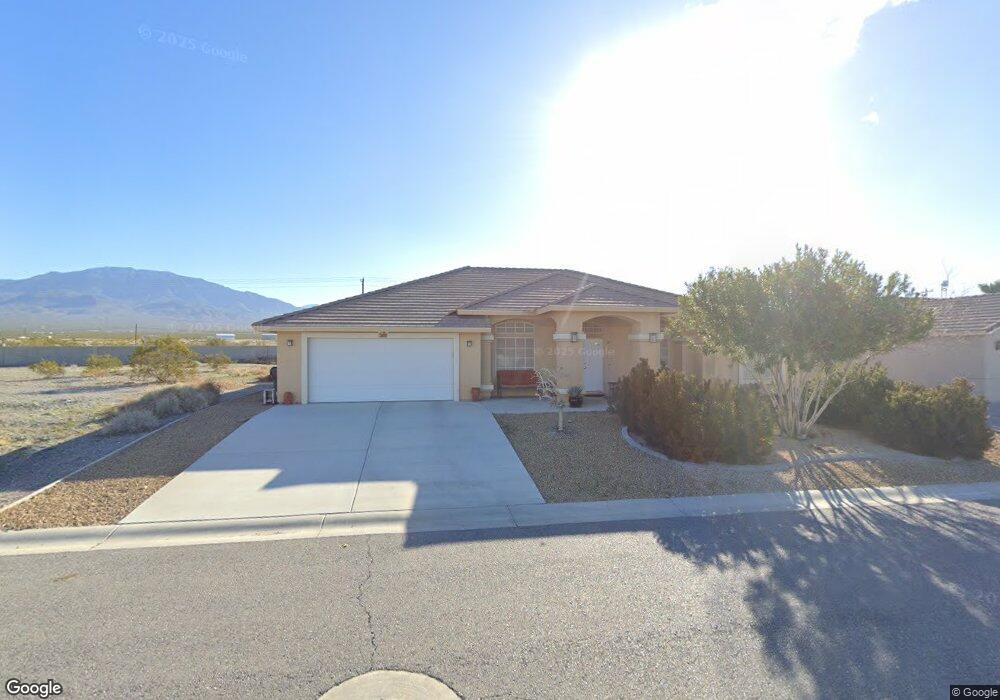
3861 N Mayfield Ranch Rd Pahrump, NV 89060
Estimated Value: $285,000 - $508,000
3
Beds
2
Baths
1,955
Sq Ft
$196/Sq Ft
Est. Value
About This Home
This home is located at 3861 N Mayfield Ranch Rd, Pahrump, NV 89060 and is currently estimated at $382,349, approximately $195 per square foot. 3861 N Mayfield Ranch Rd is a home located in Nye County with nearby schools including Manse Elementary School, Rosemary Clarke Middle School, and Pahrump Valley High School.
Ownership History
Date
Name
Owned For
Owner Type
Purchase Details
Closed on
Dec 17, 2016
Sold by
Cotton Cynthia
Bought by
Cotton Cynthia D
Current Estimated Value
Home Financials for this Owner
Home Financials are based on the most recent Mortgage that was taken out on this home.
Original Mortgage
$63,085
Outstanding Balance
$30,480
Interest Rate
3.62%
Mortgage Type
FHA
Estimated Equity
$351,869
Purchase Details
Closed on
Oct 13, 2011
Sold by
Blackwill & Sons Truckling Inc
Bought by
Cotton Cynthia
Home Financials for this Owner
Home Financials are based on the most recent Mortgage that was taken out on this home.
Original Mortgage
$82,300
Interest Rate
4.02%
Mortgage Type
Seller Take Back
Purchase Details
Closed on
Jul 18, 2011
Sold by
Greenwald Kurtis M and Greenwald Mika L
Bought by
Blackwill & Sons Trucking Inc
Create a Home Valuation Report for This Property
The Home Valuation Report is an in-depth analysis detailing your home's value as well as a comparison with similar homes in the area
Home Values in the Area
Average Home Value in this Area
Purchase History
| Date | Buyer | Sale Price | Title Company |
|---|---|---|---|
| Cotton Cynthia D | -- | Fidelity National Tit | |
| Cotton Cynthia | $82,500 | First American Title | |
| Blackwill & Sons Trucking Inc | $80,800 | None Available |
Source: Public Records
Mortgage History
| Date | Status | Borrower | Loan Amount |
|---|---|---|---|
| Open | Cotton Cynthia D | $63,085 | |
| Closed | Cotton Cynthia | $82,300 |
Source: Public Records
Tax History Compared to Growth
Tax History
| Year | Tax Paid | Tax Assessment Tax Assessment Total Assessment is a certain percentage of the fair market value that is determined by local assessors to be the total taxable value of land and additions on the property. | Land | Improvement |
|---|---|---|---|---|
| 2025 | $1,628 | $80,131 | $4,466 | $75,665 |
| 2024 | $1,628 | $81,245 | $4,466 | $76,779 |
| 2023 | $1,628 | $74,893 | $4,466 | $70,427 |
| 2022 | $1,533 | $68,732 | $4,466 | $64,266 |
| 2021 | $1,492 | $65,386 | $3,573 | $61,813 |
| 2020 | $1,449 | $65,292 | $3,573 | $61,719 |
| 2019 | $1,407 | $76,367 | $3,573 | $72,794 |
| 2018 | $1,367 | $69,882 | $2,858 | $67,024 |
| 2017 | $1,329 | $56,227 | $2,858 | $53,369 |
| 2016 | $1,296 | $42,904 | $2,858 | $40,046 |
| 2015 | $1,293 | $39,756 | $2,858 | $36,898 |
| 2014 | $1,257 | $34,705 | $2,858 | $31,847 |
Source: Public Records
Map
Nearby Homes
- 3829 N Mayfield Ranch Rd
- 691 Courtney Ln
- 3925 N Mayfield Ranch Rd
- 3897 N Mayfield Ranch Rd
- 3871 N Mayfield Ranch Rd
- 620 Krysta Ln
- 3700 Jenny Cir
- 3840 Point Dr
- 3820 Point Dr
- 3920 Point Dr
- 3541 Frontage Rd
- 3760 Terry Dr
- 610 Fehrs Way
- 551 Munsell Way
- 3440 N Monument Ave
- 3960 Dart Dr
- 1100 Gem Place
- 3361 N Nevada Highway 160
- 1121 Jade Place
- 3901 Leonard St
- 3841 N Mayfield Ranch Rd
- 690 Elsie Ln
- 3815 N Mayfield Ranch Rd
- 690 Mazelle Ln
- 672 Elsie Ln
- 3911 N Mayfield Ranch Rd
- 3799 N Mayfield Ranch Rd
- 673 Elsie Ln
- 672 Mazelle Ln
- 691 Mazelle Ln
- 3785 N Mayfield Ranch Rd
- 690 Courtney Ln
- 655 Elsie Ln
- 673 Courtney Ln
- 654 Elsie Ln
- 673 Mazelle Ln
- 655 Courtney Ln
- 672 Courtney Ln
- 690 Lampshire Ln
- 3939 N Mayfield Ranch Rd