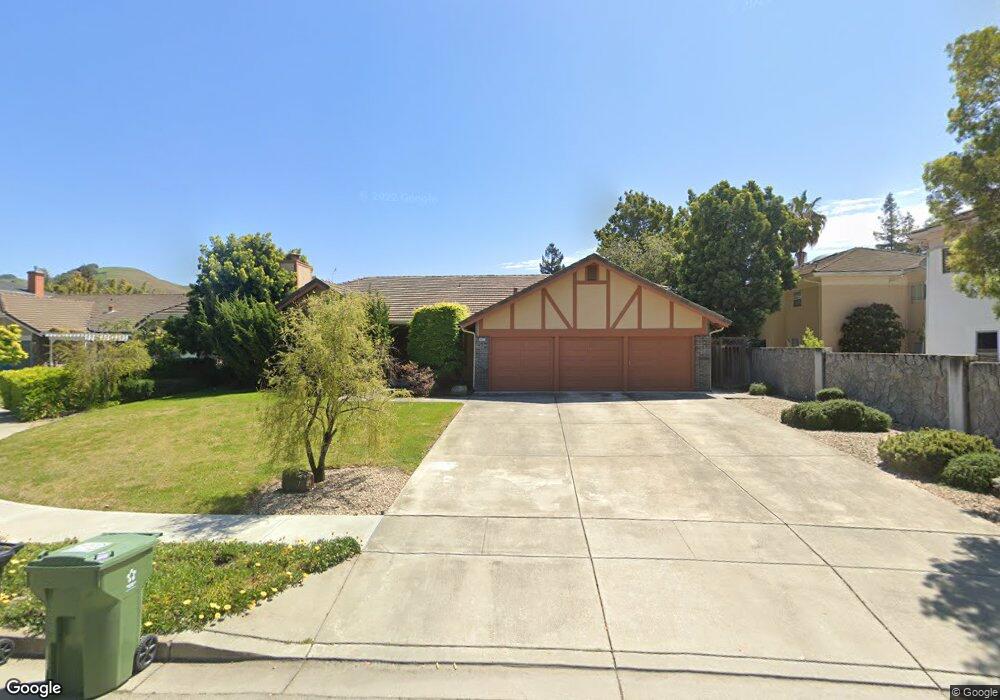
38625 Oliver Way Fremont, CA 94536
Canyon Heights-Vallejo Mills NeighborhoodEstimated Value: $1,912,000 - $2,392,000
2
Beds
3
Baths
2,317
Sq Ft
$913/Sq Ft
Est. Value
About This Home
This home is located at 38625 Oliver Way, Fremont, CA 94536 and is currently estimated at $2,115,518, approximately $913 per square foot. 38625 Oliver Way is a home located in Alameda County with nearby schools including Vallejo Mill Elementary School, Centerville Junior High School, and Washington High School.
Ownership History
Date
Name
Owned For
Owner Type
Purchase Details
Closed on
Feb 12, 2025
Sold by
James Hobart Finney and James Claire Leontine
Bought by
Finney Sean Patrick
Current Estimated Value
Home Financials for this Owner
Home Financials are based on the most recent Mortgage that was taken out on this home.
Original Mortgage
$400,000
Interest Rate
7.04%
Mortgage Type
New Conventional
Purchase Details
Closed on
Mar 18, 2002
Sold by
Finney James Hobart and Finney Claire Leontine
Bought by
Finney James Hobart and Finney Claire Leontine
Home Financials for this Owner
Home Financials are based on the most recent Mortgage that was taken out on this home.
Original Mortgage
$159,000
Interest Rate
5.62%
Mortgage Type
Purchase Money Mortgage
Purchase Details
Closed on
Apr 10, 1998
Sold by
Finney James H and Finney Claire L
Bought by
Finney James Hobart and Finney Claire Leontine
Create a Home Valuation Report for This Property
The Home Valuation Report is an in-depth analysis detailing your home's value as well as a comparison with similar homes in the area
Home Values in the Area
Average Home Value in this Area
Purchase History
| Date | Buyer | Sale Price | Title Company |
|---|---|---|---|
| Finney Sean Patrick | -- | None Listed On Document | |
| Finney James Hobart | -- | -- | |
| Finney James Hobart | -- | -- | |
| Finney James Hobart | -- | -- |
Source: Public Records
Mortgage History
| Date | Status | Borrower | Loan Amount |
|---|---|---|---|
| Previous Owner | Finney Sean Patrick | $400,000 | |
| Previous Owner | Finney James Hobart | $159,000 |
Source: Public Records
Tax History Compared to Growth
Tax History
| Year | Tax Paid | Tax Assessment Tax Assessment Total Assessment is a certain percentage of the fair market value that is determined by local assessors to be the total taxable value of land and additions on the property. | Land | Improvement |
|---|---|---|---|---|
| 2025 | $6,984 | $1,262,967 | $367,450 | $895,517 |
| 2024 | $6,984 | $543,986 | $154,080 | $396,906 |
| 2023 | $6,788 | $540,183 | $151,059 | $389,124 |
| 2022 | $6,688 | $522,592 | $148,097 | $381,495 |
| 2021 | $6,526 | $512,208 | $145,193 | $374,015 |
| 2020 | $6,508 | $513,886 | $143,705 | $370,181 |
| 2019 | $6,435 | $503,810 | $140,887 | $362,923 |
| 2018 | $6,307 | $493,934 | $138,125 | $355,809 |
| 2017 | $6,149 | $484,250 | $135,417 | $348,833 |
| 2016 | $6,003 | $471,757 | $132,763 | $338,994 |
| 2015 | $5,917 | $464,672 | $130,769 | $333,903 |
| 2014 | $5,811 | $455,569 | $128,207 | $327,362 |
Source: Public Records
Map
Nearby Homes
- 22 Sea Crest Terrace
- 38367 Oliver Way
- 38555 Overacker Ave
- 111 Overacker Terrace
- 599 Wasatch Dr
- 711 Old Canyon Rd Unit SPC 33
- 711 Old Canyon Rd Unit 6
- 711 Old Canyon Rd Unit 97
- 711 Old Canyon Rd Unit 77
- 711 Old Canyon Rd Unit 47
- 711 Old Canyon Rd Unit 103
- 711 Old Canyon Rd Unit 56
- 4 Morrison Canyon Rd
- 2 Morrison Canyon Rd
- 38345 Timpanogas Cir
- 3 Morrison Canyon Rd
- 118 Sycamore St
- 38521 Royal Ann Common
- 38721 Cherry Ln
- 38071 3rd St
- 38662 Dow Ct
- 38649 Oliver Way
- 38674 Dow Ct
- 38675 Pickering Terrace
- 38660 Pickering Terrace
- 38582 Oliver Way
- 38667 Dow Ct
- 38686 Dow Ct
- 38630 Oliver Way
- 38669 Dow Ct
- 38655 Dow Ct
- 38598 Oliver Way
- 38636 Dow Ct
- 38614 Oliver Way
- 38566 Oliver Way
- 142 Pickering Ave
- 38683 Dow Ct
- 186 Pickering Ave
- 38698 Dow Ct
- 192 Pickering Ave