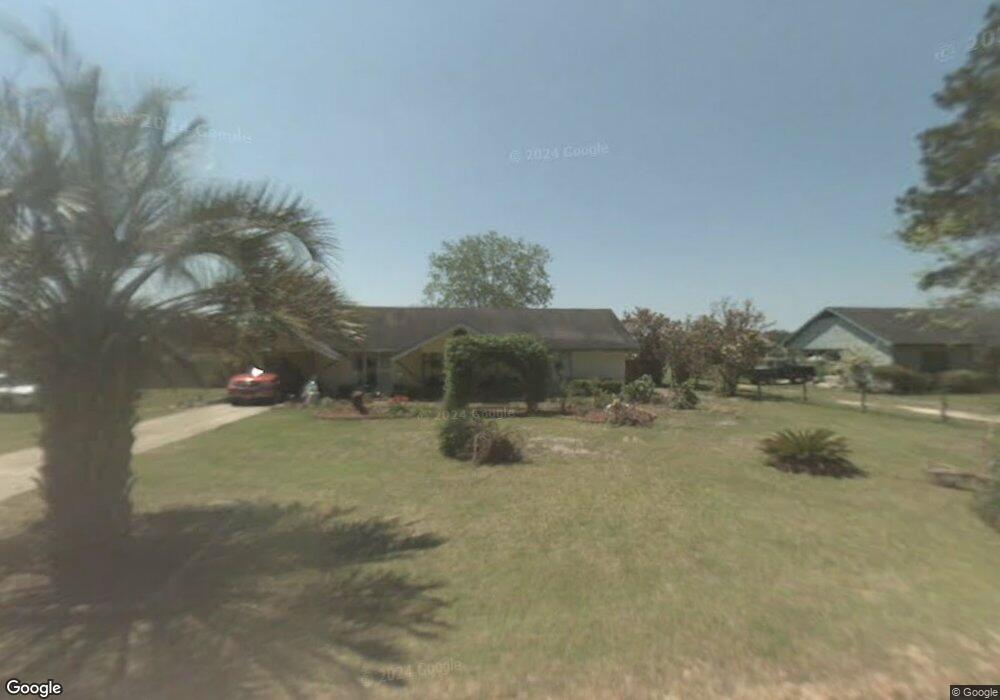
3863 Aspinwall Ln Blackshear, GA 31516
Estimated Value: $251,870 - $293,000
3
Beds
2
Baths
1,640
Sq Ft
$164/Sq Ft
Est. Value
About This Home
This home is located at 3863 Aspinwall Ln, Blackshear, GA 31516 and is currently estimated at $268,968, approximately $164 per square foot. 3863 Aspinwall Ln is a home located in Pierce County with nearby schools including Pierce County High School and Truth Christian Academy.
Ownership History
Date
Name
Owned For
Owner Type
Purchase Details
Closed on
Jul 16, 2008
Sold by
Crews David Lamar
Bought by
Crews Rita Marlene
Current Estimated Value
Purchase Details
Closed on
Jul 15, 2008
Sold by
Crews David Lamar
Bought by
Crews Rita Marlene
Purchase Details
Closed on
Nov 15, 1978
Sold by
Dixon Jerry A
Bought by
Crews Lamar
Purchase Details
Closed on
Aug 9, 1976
Sold by
Clark Thomas Jerry and Wayne Clough
Bought by
Crews David Lamar and Rita Marlene
Create a Home Valuation Report for This Property
The Home Valuation Report is an in-depth analysis detailing your home's value as well as a comparison with similar homes in the area
Home Values in the Area
Average Home Value in this Area
Purchase History
| Date | Buyer | Sale Price | Title Company |
|---|---|---|---|
| Crews Rita Marlene | -- | -- | |
| Crews Rita Marlene | -- | -- | |
| Crews Lamar | -- | -- | |
| Crews David Lamar | $32,000 | -- |
Source: Public Records
Tax History Compared to Growth
Tax History
| Year | Tax Paid | Tax Assessment Tax Assessment Total Assessment is a certain percentage of the fair market value that is determined by local assessors to be the total taxable value of land and additions on the property. | Land | Improvement |
|---|---|---|---|---|
| 2024 | $834 | $71,790 | $4,240 | $67,550 |
| 2023 | $834 | $71,228 | $4,240 | $66,988 |
| 2022 | $668 | $43,410 | $3,478 | $39,932 |
| 2021 | $655 | $41,980 | $3,478 | $38,502 |
| 2020 | $665 | $40,549 | $3,478 | $37,071 |
| 2019 | $653 | $39,651 | $3,478 | $36,173 |
| 2018 | $652 | $38,097 | $3,313 | $34,784 |
| 2017 | $1,016 | $36,987 | $3,313 | $33,674 |
| 2016 | $650 | $36,987 | $3,313 | $33,674 |
| 2015 | $535 | $36,987 | $3,313 | $33,674 |
| 2014 | $535 | $36,987 | $3,313 | $33,674 |
| 2013 | $535 | $36,987 | $3,312 | $33,674 |
Source: Public Records
Map
Nearby Homes
- 3951 Golfview Dr
- 3930 Golfview Dr
- 4131 Mulligan Cir
- 5605 Ga Highway 121
- 6324 Bailey Rd
- 3602 Meadow Ln
- 1207 College Ave
- 1114 Laurel St
- 1120 College Ave
- 209 Woodlawn Terrace
- 6499 Bailey Rd
- 118 Pinehurst Dr
- 4119 Renee Ln
- 113 Tatum Ln
- 4160 Deerwood Ln
- 915 Jane St
- 936 Azalea St
- 6552 Kenny Ln
- 933 Azalea St
- 830 Jane St