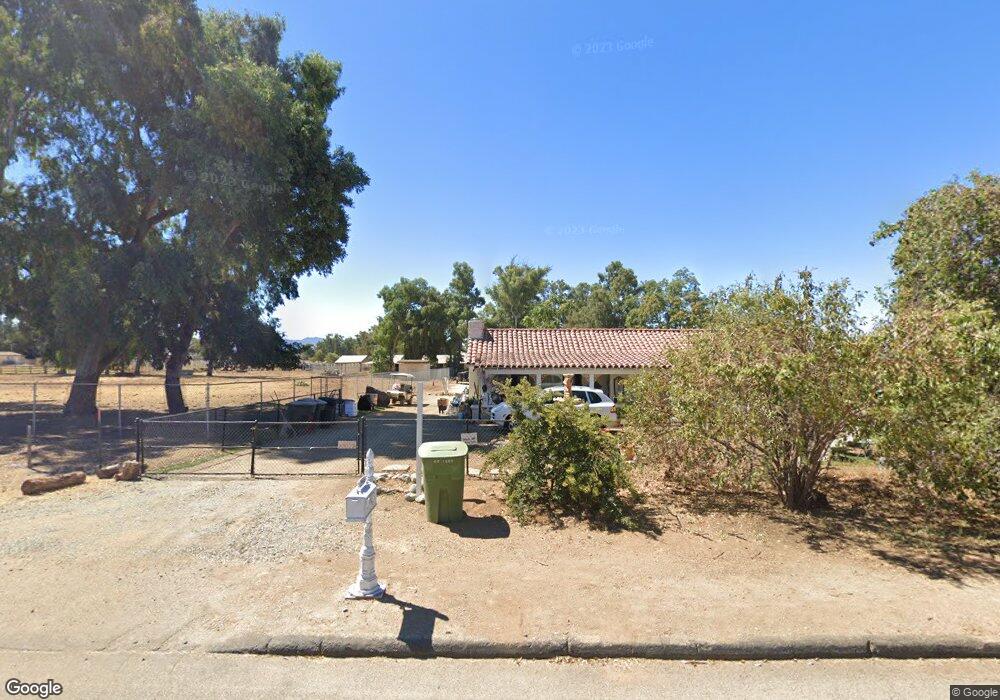
38649 Cherry Valley Blvd Cherry Valley, CA 92223
Estimated Value: $331,000 - $812,000
2
Beds
3
Baths
2,532
Sq Ft
$221/Sq Ft
Est. Value
About This Home
This home is located at 38649 Cherry Valley Blvd, Cherry Valley, CA 92223 and is currently estimated at $560,000, approximately $221 per square foot. 38649 Cherry Valley Blvd is a home located in Riverside County with nearby schools including Brookside Elementary School, Mountain View Middle School, and Beaumont Senior High School.
Ownership History
Date
Name
Owned For
Owner Type
Purchase Details
Closed on
Aug 1, 2017
Sold by
Oster Mark A
Bought by
Oster Mark A
Current Estimated Value
Purchase Details
Closed on
Jun 17, 2003
Sold by
Countrywide Home Loans Inc
Bought by
Oster Mark A
Home Financials for this Owner
Home Financials are based on the most recent Mortgage that was taken out on this home.
Original Mortgage
$198,500
Outstanding Balance
$84,361
Interest Rate
5.37%
Mortgage Type
Purchase Money Mortgage
Estimated Equity
$475,639
Purchase Details
Closed on
Apr 2, 2002
Sold by
Demello Kelly Ellen
Bought by
Countrywide Home Loans
Purchase Details
Closed on
Oct 14, 1998
Sold by
Pilant Randall
Bought by
Demello Kelly Ellen
Home Financials for this Owner
Home Financials are based on the most recent Mortgage that was taken out on this home.
Original Mortgage
$157,400
Interest Rate
6.6%
Mortgage Type
Commercial
Create a Home Valuation Report for This Property
The Home Valuation Report is an in-depth analysis detailing your home's value as well as a comparison with similar homes in the area
Home Values in the Area
Average Home Value in this Area
Purchase History
| Date | Buyer | Sale Price | Title Company |
|---|---|---|---|
| Oster Mark A | -- | None Available | |
| Oster Mark A | $209,000 | Landsafe Title | |
| Oster Mark A | -- | Landsafe Title | |
| Countrywide Home Loans | $167,597 | Landsafe Title | |
| Demello Kelly Ellen | -- | Orange Coast Title | |
| Demello Kelly Ellen | $175,000 | Orange Coast Title |
Source: Public Records
Mortgage History
| Date | Status | Borrower | Loan Amount |
|---|---|---|---|
| Open | Oster Mark A | $198,500 | |
| Previous Owner | Demello Kelly Ellen | $157,400 |
Source: Public Records
Tax History
| Year | Tax Paid | Tax Assessment Tax Assessment Total Assessment is a certain percentage of the fair market value that is determined by local assessors to be the total taxable value of land and additions on the property. | Land | Improvement |
|---|---|---|---|---|
| 2025 | $3,752 | $297,130 | $106,622 | $190,508 |
| 2023 | $3,752 | $285,594 | $102,483 | $183,111 |
| 2022 | $3,691 | $279,995 | $100,474 | $179,521 |
| 2021 | $3,619 | $274,505 | $98,504 | $176,001 |
| 2020 | $3,581 | $271,691 | $97,494 | $174,197 |
| 2019 | $3,523 | $266,365 | $95,583 | $170,782 |
| 2018 | $4,041 | $261,143 | $93,709 | $167,434 |
| 2017 | $3,451 | $256,023 | $91,872 | $164,151 |
| 2016 | $3,359 | $251,004 | $90,071 | $160,933 |
| 2015 | $3,302 | $247,235 | $88,719 | $158,516 |
| 2014 | $2,565 | $189,000 | $68,000 | $121,000 |
Source: Public Records
Map
Nearby Homes
- 38535 Vineland St
- 39068 Vineland St
- 805 Annandale Rd
- 38011 Vineland St
- 9870 Nancy Ave
- 860 Annandale Rd
- 1764 Muirfield Ln
- 10132 Taylor Dr
- 1771 N Forest Oaks Dr
- 10007 Beaumont Ave
- 1760 Scottsdale Rd
- 9841 Kehl Canyon Rd
- 38608 Pass View Dr
- 9678 Slope Ave
- 9728 Mountain View Ave
- 1729 Scottsdale Rd
- 785 Pine Ridge Cir
- 10410 Live Oak Ave
- 744 Copper Cir
- 9710 Mountain View Ave
- 38648 Cherry Valley Blvd
- 38678 Cherry Valley Blvd
- 38656 Cherry Valley Blvd
- 38634 Cherry Valley Blvd
- 38701 Cherry Valley Blvd
- 38620 Cherry Valley Blvd
- 38705 Cherry Valley Blvd
- 38610 Cherry Valley Blvd
- 38690 Cherry Valley Blvd
- 38520 Cherry Valley Blvd
- 38507 Cherry Valley Blvd
- 10498 Nancy Ave
- 38745 Cherry Valley Blvd
- 10434 Nancy Ave
- 38756 Cherry Valley Blvd
- 10610 Virginia Ln
- 38790 Cherry Valley Blvd
- 10664 Nancy Ave
- 10427 Nancy Ave
- 10350 Nancy Ave
Your Personal Tour Guide
Ask me questions while you tour the home.