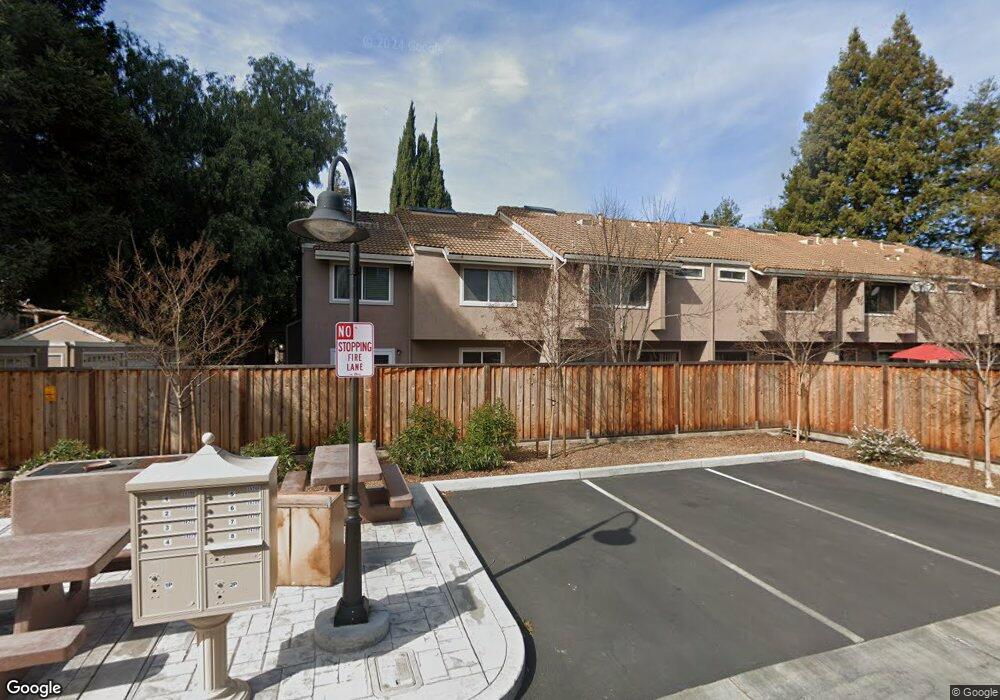
3865 Burton Common Fremont, CA 94536
Centerville District NeighborhoodEstimated Value: $897,512 - $1,080,000
2
Beds
3
Baths
1,400
Sq Ft
$723/Sq Ft
Est. Value
About This Home
This home is located at 3865 Burton Common, Fremont, CA 94536 and is currently estimated at $1,012,128, approximately $722 per square foot. 3865 Burton Common is a home located in Alameda County with nearby schools including Parkmont Elementary School, Centerville Junior High School, and Washington High School.
Ownership History
Date
Name
Owned For
Owner Type
Purchase Details
Closed on
Jan 10, 2006
Sold by
Feinstein Valery and Orshansky Meri
Bought by
Feinstein Valery and Orshansky Meri
Current Estimated Value
Purchase Details
Closed on
Feb 1, 2000
Sold by
Pettus Glenn A Goodwin R L and Pettus Michelle D
Bought by
Feinstein Valery and Orshansky Meri
Home Financials for this Owner
Home Financials are based on the most recent Mortgage that was taken out on this home.
Original Mortgage
$196,000
Outstanding Balance
$62,851
Interest Rate
7.75%
Estimated Equity
$949,277
Purchase Details
Closed on
Jun 25, 1997
Sold by
Cheng Steven and Cheng Calvin
Bought by
Goodwin Riordan and Goodwin Michelle
Home Financials for this Owner
Home Financials are based on the most recent Mortgage that was taken out on this home.
Original Mortgage
$140,250
Interest Rate
7.92%
Create a Home Valuation Report for This Property
The Home Valuation Report is an in-depth analysis detailing your home's value as well as a comparison with similar homes in the area
Home Values in the Area
Average Home Value in this Area
Purchase History
| Date | Buyer | Sale Price | Title Company |
|---|---|---|---|
| Feinstein Valery | -- | None Available | |
| Feinstein Valery | $245,000 | Fidelity National Title Co | |
| Goodwin Riordan | $187,000 | Placer Title Company |
Source: Public Records
Mortgage History
| Date | Status | Borrower | Loan Amount |
|---|---|---|---|
| Open | Feinstein Valery | $196,000 | |
| Previous Owner | Goodwin Riordan | $140,250 |
Source: Public Records
Tax History Compared to Growth
Tax History
| Year | Tax Paid | Tax Assessment Tax Assessment Total Assessment is a certain percentage of the fair market value that is determined by local assessors to be the total taxable value of land and additions on the property. | Land | Improvement |
|---|---|---|---|---|
| 2025 | $4,778 | $369,537 | $112,961 | $263,576 |
| 2024 | $4,778 | $362,155 | $110,746 | $258,409 |
| 2023 | $4,638 | $361,918 | $108,575 | $253,343 |
| 2022 | $4,562 | $347,823 | $106,447 | $248,376 |
| 2021 | $4,457 | $340,867 | $104,360 | $243,507 |
| 2020 | $4,410 | $344,303 | $103,291 | $241,012 |
| 2019 | $4,361 | $337,553 | $101,266 | $236,287 |
| 2018 | $4,272 | $330,935 | $99,280 | $231,655 |
| 2017 | $4,163 | $324,448 | $97,334 | $227,114 |
| 2016 | $4,082 | $318,087 | $95,426 | $222,661 |
| 2015 | $4,036 | $313,310 | $93,993 | $219,317 |
| 2014 | $3,967 | $307,173 | $92,152 | $215,021 |
Source: Public Records
Map
Nearby Homes
- 3833 Burton Common
- 3810 Burton Common
- 38030 Dundee Common
- 38265 Corrigan Ct
- 37637 Canterbury St
- 3006 Eggers Dr
- 38611 Country Common
- 4328 Cognina Ct
- 37993 Ponderosa Terrace
- 38228 Paseo Padre Pkwy Unit 24
- 4237 Garland Dr
- 38837 Fremont Blvd
- Plan 1629 at Veranda
- Plan 1165 at Veranda
- Plan 1670 at Veranda
- Plan 1455 at Veranda
- Plan 1394 at Veranda
- Plan 1725 at Veranda
- Plan 1378 at Veranda
- Plan 1657 at Veranda
- 3867 Burton Common
- 3863 Burton Common
- 3869 Burton Common
- 3871 Burton Common
- 3881 Burton Common
- 3866 Burton Common
- 3864 Burton Common
- 3862 Burton Common
- 3883 Burton Common
- 3868 Burton Common
- 3870 Burton Common
- 3860 Burton Common
- 3843 Burton Common
- 3885 Burton Common
- 3799 Colet Terrace
- 3887 Burton Common
- 3841 Burton Common
- 3878 Burton Common
- 3779 Colet Terrace
- 3880 Burton Common