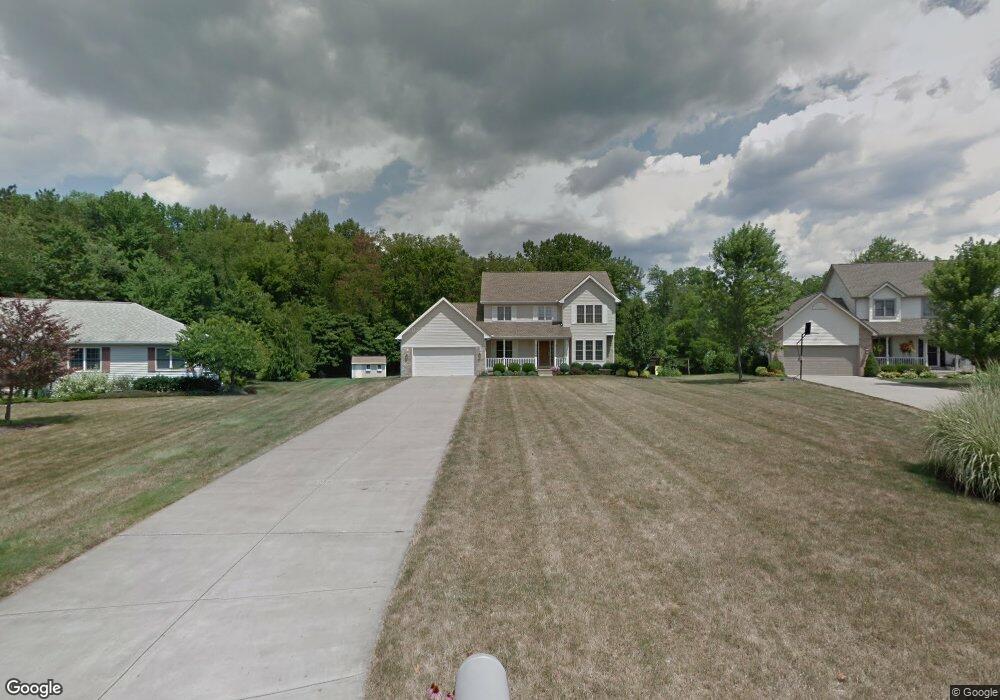
3867 Meander Dr Mineral Ridge, OH 44440
Estimated Value: $371,558 - $416,000
3
Beds
3
Baths
2,084
Sq Ft
$190/Sq Ft
Est. Value
About This Home
This home is located at 3867 Meander Dr, Mineral Ridge, OH 44440 and is currently estimated at $396,140, approximately $190 per square foot. 3867 Meander Dr is a home located in Trumbull County with nearby schools including Seaborn Elementary School and Mineral Ridge High School.
Ownership History
Date
Name
Owned For
Owner Type
Purchase Details
Closed on
Jan 23, 2014
Sold by
Glunt Patrick J and Glunt Diana L
Bought by
Rouan David A and Rouan Kimberly A
Current Estimated Value
Home Financials for this Owner
Home Financials are based on the most recent Mortgage that was taken out on this home.
Original Mortgage
$165,521
Interest Rate
4.37%
Mortgage Type
FHA
Purchase Details
Closed on
Nov 10, 2009
Sold by
Morse Ernest F
Bought by
Glunt Patrick J and Glunt Diana L
Purchase Details
Closed on
Nov 10, 2008
Sold by
Glunt Patrick J and Glunt Diana L
Bought by
Rouan David A and Rouan Kimberly A
Home Financials for this Owner
Home Financials are based on the most recent Mortgage that was taken out on this home.
Original Mortgage
$175,500
Interest Rate
4.96%
Mortgage Type
Seller Take Back
Purchase Details
Closed on
Jun 12, 2003
Sold by
S&L Land Development Ltd
Bought by
Morse Ernest F
Create a Home Valuation Report for This Property
The Home Valuation Report is an in-depth analysis detailing your home's value as well as a comparison with similar homes in the area
Home Values in the Area
Average Home Value in this Area
Purchase History
| Date | Buyer | Sale Price | Title Company |
|---|---|---|---|
| Rouan David A | $185,000 | None Available | |
| Glunt Patrick J | $185,500 | Attorney | |
| Rouan David A | $185,500 | Attorney | |
| Morse Ernest F | $31,000 | -- |
Source: Public Records
Mortgage History
| Date | Status | Borrower | Loan Amount |
|---|---|---|---|
| Previous Owner | Rouan David A | $165,521 | |
| Previous Owner | Rouan David A | $175,500 |
Source: Public Records
Tax History Compared to Growth
Tax History
| Year | Tax Paid | Tax Assessment Tax Assessment Total Assessment is a certain percentage of the fair market value that is determined by local assessors to be the total taxable value of land and additions on the property. | Land | Improvement |
|---|---|---|---|---|
| 2024 | $4,942 | $103,290 | $11,900 | $91,390 |
| 2023 | $4,942 | $103,290 | $11,900 | $91,390 |
| 2022 | $3,810 | $74,240 | $11,900 | $62,340 |
| 2021 | $3,808 | $74,240 | $11,900 | $62,340 |
| 2020 | $3,815 | $74,240 | $11,900 | $62,340 |
| 2019 | $3,574 | $64,720 | $11,900 | $52,820 |
| 2018 | $3,559 | $64,720 | $11,900 | $52,820 |
| 2017 | $3,557 | $64,720 | $11,900 | $52,820 |
| 2016 | $3,475 | $60,270 | $11,200 | $49,070 |
| 2015 | $3,469 | $60,270 | $11,200 | $49,070 |
| 2014 | $3,562 | $60,270 | $11,200 | $49,070 |
| 2013 | $3,518 | $60,270 | $11,200 | $49,070 |
Source: Public Records
Map
Nearby Homes
- 3907 Edwards St
- 6 Omalia Dr
- 6360 Meander Glen Dr
- 6393 Meander Glen Dr
- 3872 Main St
- 1458 Lincoln Ave
- 1445 E County Line Rd
- 21 E Liberty St
- 3440 Lakeside Dr
- 1218 Ohltown McDonald Rd
- 3474 S Main St
- 0 W Webb Rd
- 1676 Rosalyn Cir
- 1684 Morris St
- 3328 Main St
- 1757 E County Line Rd
- 1239 Woodledge Dr
- 5085 Winslow Dr
- 1721 Ohltown McDonald Rd
- 500 N Turner Rd
- 3875 Meander Dr
- 3863 Meander Dr
- 3881 Meander Dr
- 3855 Meander Dr
- 3862 Meander Dr
- 3890 Meander Dr
- 3854 Meander Dr
- 3889 Meander Dr
- 3847 Meander Dr
- 3895 Meander Dr
- 3839 Meander Dr
- 3846 Meander Dr
- 3896 Meander Dr
- 1186 Ridge Lake Dr Unit 6
- 1160 Depot St
- 1196 Ridge Lake Dr Unit 1196
- 3838 Meander Dr
- 1192 Ridge Lake Dr Unit D7
- 3905 Meander Dr
- 3831 Meander Dr