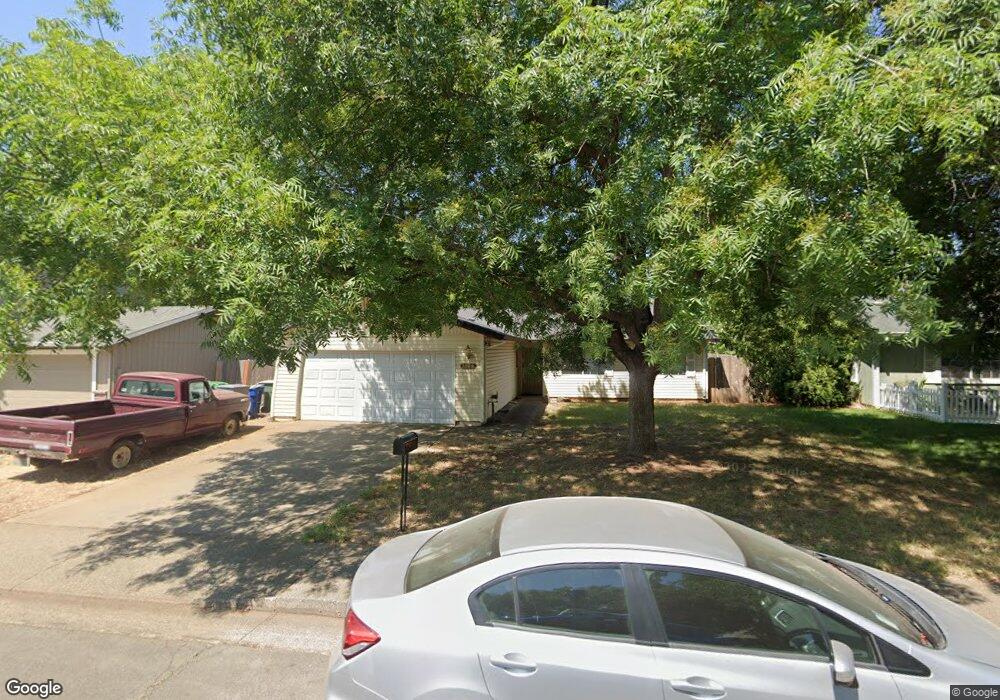
3868 Pluto St Redding, CA 96002
Starview NeighborhoodEstimated Value: $269,610 - $314,000
3
Beds
1
Bath
1,200
Sq Ft
$240/Sq Ft
Est. Value
About This Home
This home is located at 3868 Pluto St, Redding, CA 96002 and is currently estimated at $287,403, approximately $239 per square foot. 3868 Pluto St is a home located in Shasta County with nearby schools including Alta Mesa Elementary School, Parsons Junior High School, and Enterprise High School.
Ownership History
Date
Name
Owned For
Owner Type
Purchase Details
Closed on
Nov 18, 2006
Sold by
Sisson Carrie
Bought by
Sisson Carrie
Current Estimated Value
Home Financials for this Owner
Home Financials are based on the most recent Mortgage that was taken out on this home.
Original Mortgage
$154,000
Outstanding Balance
$91,960
Interest Rate
6.38%
Mortgage Type
Stand Alone Refi Refinance Of Original Loan
Estimated Equity
$195,443
Purchase Details
Closed on
Aug 23, 2005
Sold by
Sisson B Steve
Bought by
Sisson Carrie
Home Financials for this Owner
Home Financials are based on the most recent Mortgage that was taken out on this home.
Original Mortgage
$144,000
Interest Rate
5.81%
Mortgage Type
Stand Alone Refi Refinance Of Original Loan
Purchase Details
Closed on
Aug 23, 1999
Sold by
Family Trust Of 1992 Guthrie William L & Bern
Bought by
Sisson B Steve and Sisson Carrie
Home Financials for this Owner
Home Financials are based on the most recent Mortgage that was taken out on this home.
Original Mortgage
$81,874
Interest Rate
7.56%
Mortgage Type
FHA
Create a Home Valuation Report for This Property
The Home Valuation Report is an in-depth analysis detailing your home's value as well as a comparison with similar homes in the area
Home Values in the Area
Average Home Value in this Area
Purchase History
| Date | Buyer | Sale Price | Title Company |
|---|---|---|---|
| Sisson Carrie | -- | First American Title Ins Co | |
| Sisson Carrie | -- | Chicago Title Co | |
| Sisson B Steve | $82,000 | Placer Title Company |
Source: Public Records
Mortgage History
| Date | Status | Borrower | Loan Amount |
|---|---|---|---|
| Open | Sisson Carrie | $154,000 | |
| Closed | Sisson Carrie | $144,000 | |
| Closed | Sisson B Steve | $81,874 | |
| Closed | Sisson B Steve | $4,093 |
Source: Public Records
Tax History
| Year | Tax Paid | Tax Assessment Tax Assessment Total Assessment is a certain percentage of the fair market value that is determined by local assessors to be the total taxable value of land and additions on the property. | Land | Improvement |
|---|---|---|---|---|
| 2025 | $1,316 | $126,003 | $33,798 | $92,205 |
| 2024 | $1,296 | $123,534 | $33,136 | $90,398 |
| 2023 | $1,296 | $121,113 | $32,487 | $88,626 |
| 2022 | $1,258 | $118,739 | $31,850 | $86,889 |
| 2021 | $1,213 | $116,412 | $31,226 | $85,186 |
| 2020 | $1,207 | $115,219 | $30,906 | $84,313 |
| 2019 | $1,196 | $112,960 | $30,300 | $82,660 |
| 2018 | $1,180 | $110,746 | $29,706 | $81,040 |
| 2017 | $1,199 | $108,575 | $29,124 | $79,451 |
| 2016 | $1,121 | $106,447 | $28,553 | $77,894 |
| 2015 | $1,110 | $104,849 | $28,125 | $76,724 |
| 2014 | $1,101 | $102,797 | $27,575 | $75,222 |
Source: Public Records
Map
Nearby Homes
- 2332 Venus Way
- 4001 Alta Mesa Dr
- 3688 Polaris Way
- 2068 Solar Way
- 3594 Laramie St
- 3512 Capricorn Way
- 2354 Suzette Ave
- 3361 Alta Mesa Dr
- 3528 Silverwood St
- 3466 Silverwood St
- 3425 Silverwood St
- 3341 Timbercreek Dr
- 2704 Western Oak Dr
- 0 Shasta View Unit 25-1945
- 2366 Templeton Dr
- 2875 Eastbrook Dr
- 4302 Yellowstone Dr
- 3072 Alta Mesa Dr
- 1513 Harpole Rd
- 4487 Alta Saga Dr
Your Personal Tour Guide
Ask me questions while you tour the home.