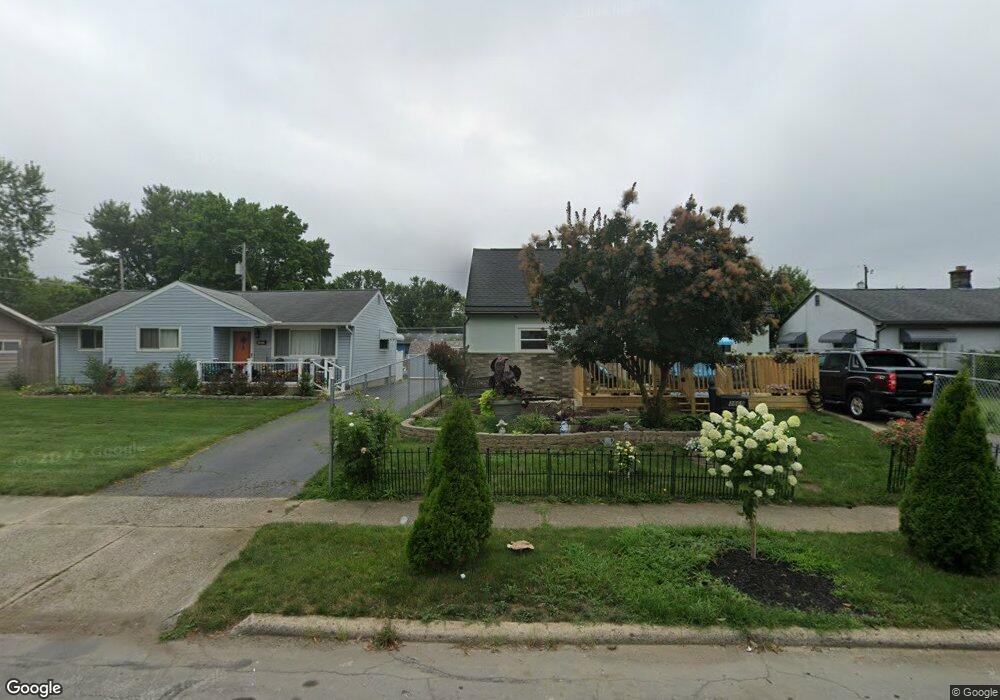
3869 Astor Ave Columbus, OH 43227
Beechwood NeighborhoodEstimated Value: $217,000 - $307,000
4
Beds
2
Baths
1,543
Sq Ft
$164/Sq Ft
Est. Value
About This Home
This home is located at 3869 Astor Ave, Columbus, OH 43227 and is currently estimated at $253,445, approximately $164 per square foot. 3869 Astor Ave is a home located in Franklin County with nearby schools including Shady Lane Elementary School, Sherwood Middle School, and Walnut Ridge High School.
Ownership History
Date
Name
Owned For
Owner Type
Purchase Details
Closed on
Mar 24, 2006
Sold by
Seay Laurita J and Adams Laurita J
Bought by
Wallace Kimm E and Wallace Sabrina A
Current Estimated Value
Home Financials for this Owner
Home Financials are based on the most recent Mortgage that was taken out on this home.
Original Mortgage
$109,225
Outstanding Balance
$77,506
Interest Rate
10.99%
Mortgage Type
Fannie Mae Freddie Mac
Estimated Equity
$175,939
Purchase Details
Closed on
Nov 14, 2000
Sold by
Craycraft Billy J
Bought by
Seay Laurita J
Home Financials for this Owner
Home Financials are based on the most recent Mortgage that was taken out on this home.
Original Mortgage
$96,376
Interest Rate
7.87%
Mortgage Type
FHA
Purchase Details
Closed on
Jul 8, 1991
Bought by
Craycraft Billy J
Purchase Details
Closed on
Dec 9, 1988
Purchase Details
Closed on
Apr 1, 1977
Create a Home Valuation Report for This Property
The Home Valuation Report is an in-depth analysis detailing your home's value as well as a comparison with similar homes in the area
Home Values in the Area
Average Home Value in this Area
Purchase History
| Date | Buyer | Sale Price | Title Company |
|---|---|---|---|
| Wallace Kimm E | $128,500 | Title First | |
| Seay Laurita J | $96,900 | Title First Agency Inc | |
| Craycraft Billy J | -- | -- | |
| -- | $57,900 | -- | |
| -- | $36,500 | -- |
Source: Public Records
Mortgage History
| Date | Status | Borrower | Loan Amount |
|---|---|---|---|
| Open | Wallace Kimm E | $109,225 | |
| Closed | Seay Laurita J | $96,376 |
Source: Public Records
Tax History Compared to Growth
Tax History
| Year | Tax Paid | Tax Assessment Tax Assessment Total Assessment is a certain percentage of the fair market value that is determined by local assessors to be the total taxable value of land and additions on the property. | Land | Improvement |
|---|---|---|---|---|
| 2024 | $3,701 | $82,460 | $15,050 | $67,410 |
| 2023 | $3,764 | $82,460 | $15,050 | $67,410 |
| 2022 | $2,240 | $43,190 | $5,250 | $37,940 |
| 2021 | $2,244 | $43,190 | $5,250 | $37,940 |
| 2020 | $2,247 | $43,190 | $5,250 | $37,940 |
| 2019 | $2,081 | $34,300 | $4,200 | $30,100 |
| 2018 | $1,970 | $34,300 | $4,200 | $30,100 |
| 2017 | $2,066 | $34,300 | $4,200 | $30,100 |
| 2016 | $2,052 | $30,980 | $4,130 | $26,850 |
| 2015 | $1,863 | $30,980 | $4,130 | $26,850 |
| 2014 | $1,868 | $30,980 | $4,130 | $26,850 |
| 2013 | $1,083 | $36,435 | $4,865 | $31,570 |
Source: Public Records
Map
Nearby Homes
- 931 E Fulton St
- 3945 Dillon Dr
- 3955 E Fulton St
- 1220 Elderwood Ave
- 1294 Dellwood Ave
- 3598 Astor Ave
- 3563 Astor Ave
- 4144 Mcallister Ave
- 4094 E Main St
- 3811 Brentwood Ct
- 3566 Seabrook Ave
- 963 Erickson Ave
- 1291 Westphal Ave
- 4181 Colby Ave
- 892 Ruby Ave
- 1490 Elaine Rd Unit 1462
- 3353 Towers Ct S
- 798 S Yearling Rd
- 871 Ruby Ave
- 3339 Towers Ct N
- 3877 Astor Ave
- 3863 Astor Ave
- 3855 Astor Ave
- 3885 Astor Ave
- 3864 Bolton Ave
- 3870 Bolton Ave
- 3856 Bolton Ave
- 3849 Astor Ave
- 3848 Bolton Ave
- 3878 Bolton Ave
- 3872 Astor Ave
- 3891 Astor Ave
- 3866 Astor Ave
- 3880 Astor Ave
- 3888 Astor Ave
- 3858 Astor Ave
- 3842 Bolton Ave
- 3884 Bolton Ave
- 3899 Astor Ave
- 3852 Astor Ave