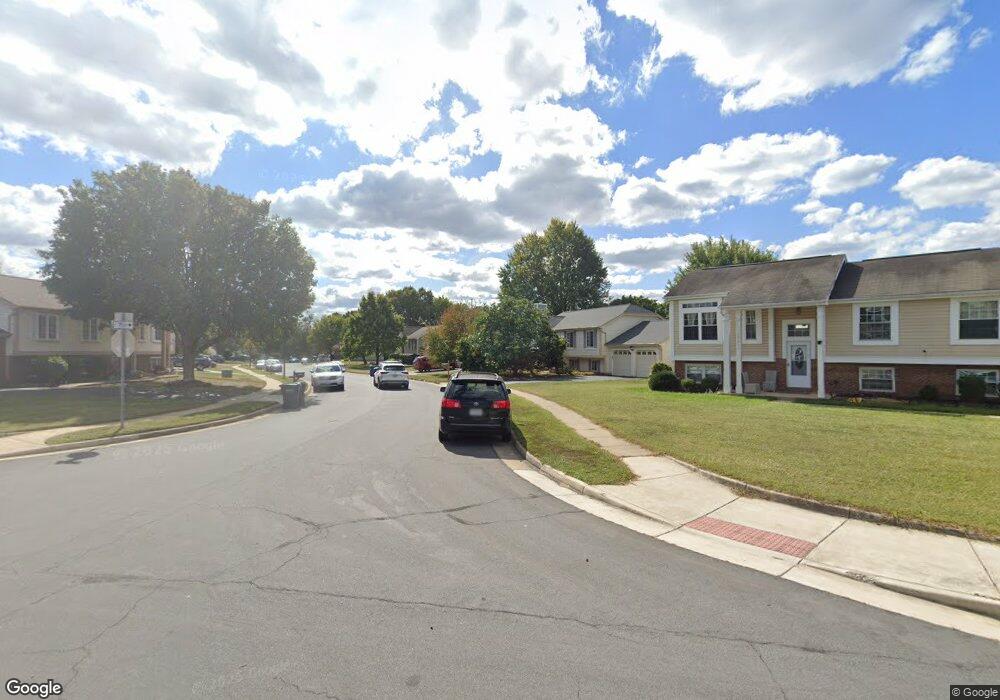
3869 Beech Down Dr Chantilly, VA 20151
Estimated Value: $731,000 - $765,000
4
Beds
4
Baths
1,782
Sq Ft
$420/Sq Ft
Est. Value
About This Home
This home is located at 3869 Beech Down Dr, Chantilly, VA 20151 and is currently estimated at $749,083, approximately $420 per square foot. 3869 Beech Down Dr is a home located in Fairfax County with nearby schools including Lees Corner Elementary, Franklin Middle, and Chantilly High School.
Ownership History
Date
Name
Owned For
Owner Type
Purchase Details
Closed on
May 8, 2003
Sold by
Duong Lilianne
Bought by
Cole Michael G
Current Estimated Value
Home Financials for this Owner
Home Financials are based on the most recent Mortgage that was taken out on this home.
Original Mortgage
$264,000
Outstanding Balance
$115,909
Interest Rate
5.93%
Mortgage Type
New Conventional
Estimated Equity
$633,174
Purchase Details
Closed on
Oct 12, 1999
Sold by
Raible Todd A
Bought by
Kapoor Sanjiv K
Home Financials for this Owner
Home Financials are based on the most recent Mortgage that was taken out on this home.
Original Mortgage
$218,025
Interest Rate
7.81%
Purchase Details
Closed on
Dec 21, 1995
Sold by
Morgan Robert D
Bought by
Raible Todd A
Home Financials for this Owner
Home Financials are based on the most recent Mortgage that was taken out on this home.
Original Mortgage
$146,000
Interest Rate
7.33%
Create a Home Valuation Report for This Property
The Home Valuation Report is an in-depth analysis detailing your home's value as well as a comparison with similar homes in the area
Home Values in the Area
Average Home Value in this Area
Purchase History
| Date | Buyer | Sale Price | Title Company |
|---|---|---|---|
| Cole Michael G | $330,000 | -- | |
| Kapoor Sanjiv K | $229,600 | -- | |
| Raible Todd A | $182,500 | -- |
Source: Public Records
Mortgage History
| Date | Status | Borrower | Loan Amount |
|---|---|---|---|
| Open | Raible Todd A | $264,000 | |
| Previous Owner | Raible Todd A | $218,025 | |
| Previous Owner | Raible Todd A | $146,000 |
Source: Public Records
Tax History
| Year | Tax Paid | Tax Assessment Tax Assessment Total Assessment is a certain percentage of the fair market value that is determined by local assessors to be the total taxable value of land and additions on the property. | Land | Improvement |
|---|---|---|---|---|
| 2025 | $7,678 | $680,870 | $259,000 | $421,870 |
| 2024 | $7,678 | $662,760 | $249,000 | $413,760 |
| 2023 | $7,159 | $634,370 | $249,000 | $385,370 |
| 2022 | $6,882 | $601,850 | $229,000 | $372,850 |
| 2021 | $6,229 | $530,820 | $214,000 | $316,820 |
| 2020 | $6,007 | $507,520 | $199,000 | $308,520 |
| 2019 | $5,626 | $475,340 | $194,000 | $281,340 |
| 2018 | $5,121 | $445,320 | $190,000 | $255,320 |
| 2017 | $5,118 | $440,790 | $188,000 | $252,790 |
| 2016 | $5,107 | $440,790 | $188,000 | $252,790 |
| 2015 | $4,919 | $440,790 | $188,000 | $252,790 |
| 2014 | $4,808 | $431,830 | $184,000 | $247,830 |
Source: Public Records
Map
Nearby Homes
- 3711 Foxfield Ln
- 3606 Canoe Birch Ct
- 13511 Chevy Chase Ct
- 13515 King Charles Dr
- 13714 Monet Ct
- 3623 Great Laurel Ln
- 3919 Bokel Dr
- 3752 Farmland Dr
- 13707 Autumn Vale Ct Unit 29E
- 3350 Oakshade Ct
- 3346 Oakshade Ct
- 4104 Hamlin Ave
- 4139 Placid Lake Ct Unit 53-F
- 13701 Rosetree Ct
- 3820 Lightfoot St Unit 316
- 3830 Lightfoot St Unit 223
- 13844 Beaujolais Ct
- 3706 Sumter Ct
- 4241 Moselle Dr
- 13110 Thompson Rd
- 3871 Beech Down Dr
- 3863 Beech Down Dr
- 16302 Bromall Ct
- 16304 Bromall Ct
- 13633 Bellerose Dr
- 3872 Beech Down Dr
- 3866 Beech Down Dr
- 3864 Beech Down Dr
- 3825 Dittany Ct
- 16306 Bromall Ct
- 3823 Dittany Ct
- 13635 Bellerose Dr
- 3862 Beech Down Dr
- 13629 Bellerose Dr
- 3857 Beech Down Dr
- 16303 Bromall Ct
- 3821 Dittany Ct
- 3860 Beech Down Dr
- 3827 Dittany Ct
- 16308 Bromall Ct
Your Personal Tour Guide
Ask me questions while you tour the home.