3869 Thomas Cross Rd Sevierville, TN 37876
Estimated Value: $145,000
3
Beds
2
Baths
1,792
Sq Ft
$81/Sq Ft
Est. Value
About This Home
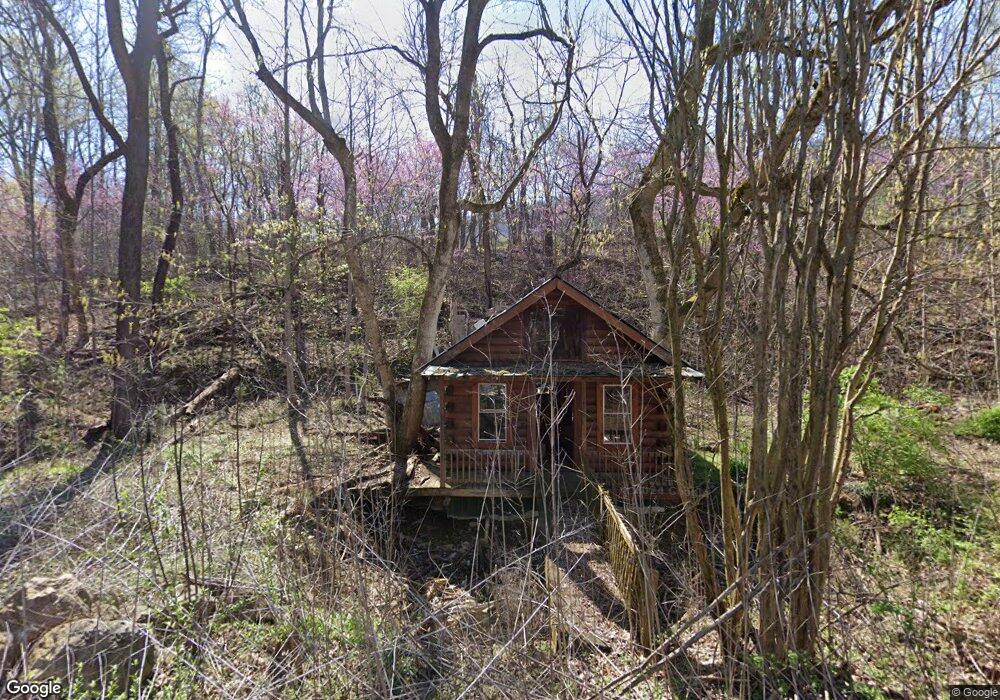
This home is located at 3869 Thomas Cross Rd, Sevierville, TN 37876 and is currently estimated at $145,000, approximately $80 per square foot. 3869 Thomas Cross Rd is a home located in Sevier County.
Ownership History
Date
Name
Owned For
Owner Type
Purchase Details
Closed on
Aug 25, 2020
Sold by
Mcgaha Charles Alexander
Bought by
Mcgaha Charles Alexander and Strange Breanna M
Current Estimated Value
Purchase Details
Closed on
Aug 17, 2020
Sold by
Strange Breanna M
Bought by
Mcgaha Charles Alexander
Purchase Details
Closed on
Jun 20, 2012
Sold by
Vanderbilt Mtg & Finance I
Bought by
Sands Betty R and Lee Amie C
Purchase Details
Closed on
Jun 27, 2011
Sold by
Jones Rhonda Sauls
Bought by
Vanderbilt Mtg And Finance Inc
Purchase Details
Closed on
Nov 21, 2005
Sold by
Robin Wofford
Bought by
Sauls Jones Rhonda
Purchase Details
Closed on
May 10, 2004
Sold by
Rep Jones Rhonda Sauls Per
Bought by
Sauls Jones Rhonda
Purchase Details
Closed on
Aug 30, 2000
Sold by
Etal Shrader Michael L
Bought by
Loretta Wofford
Purchase Details
Closed on
Jul 14, 1998
Sold by
Glenn Shrader
Bought by
Etals Shrader Michael L
Create a Home Valuation Report for This Property
The Home Valuation Report is an in-depth analysis detailing your home's value as well as a comparison with similar homes in the area
Home Values in the Area
Average Home Value in this Area
Purchase History
| Date | Buyer | Sale Price | Title Company |
|---|---|---|---|
| Mcgaha Charles Alexander | -- | Smoky Mountain Title | |
| Mcgaha Charles Alexander | -- | Smoky Mountain Title | |
| Sands Betty R | $59,965 | -- | |
| Vanderbilt Mtg And Finance Inc | $34,200 | -- | |
| Sauls Jones Rhonda | -- | -- | |
| Sauls Jones Rhonda | -- | -- | |
| Loretta Wofford | $12,000 | -- | |
| Etals Shrader Michael L | $7,900 | -- |
Source: Public Records
Tax History
| Year | Tax Paid | Tax Assessment Tax Assessment Total Assessment is a certain percentage of the fair market value that is determined by local assessors to be the total taxable value of land and additions on the property. | Land | Improvement |
|---|---|---|---|---|
| 2025 | $68 | $4,625 | $4,625 | -- |
| 2024 | $68 | $4,625 | $4,625 | -- |
| 2023 | $68 | $4,625 | $0 | $0 |
| 2022 | $68 | $4,625 | $4,625 | $0 |
| 2021 | $68 | $4,625 | $4,625 | $0 |
| 2020 | $94 | $4,625 | $4,625 | $0 |
| 2019 | $94 | $5,050 | $5,050 | $0 |
| 2018 | $94 | $5,050 | $5,050 | $0 |
| 2017 | $94 | $5,050 | $5,050 | $0 |
| 2016 | $94 | $5,050 | $5,050 | $0 |
| 2015 | -- | $22,925 | $0 | $0 |
| 2014 | $374 | $22,925 | $0 | $0 |
Source: Public Records
Map
Nearby Homes
- 3758 Old Thomas Cross Rd
- 3754 Old Thomas Cross Rd
- 3742 Old Thomas Cross Rd
- 3746 Old Thomas Cross Rd
- 3750 Old Thomas Cross Rd
- 274 Arrowhead Mountain Way
- 0 Thomas Cross Rd Unit 1312639
- 00 Thomas Cross Rd
- 268 Burning Oaks Dr
- 274 Burning Oaks Dr
- 144 Burning Oaks Dr
- 223 Burning Oaks Dr
- 320 Muscadine Ct
- 1852 Mountain Ash Way
- Tract B Mountain Ash Way
- Lot 3 Mountain Ash Way
- Tract A Mountain Ash Way
- 4151 Newport Hwy
- Lot 87 Shamrock Place
- 0 Mountain Ash Way Unit Lot 6
- 3876 Thomas Cross Rd
- 3879 Thomas Cross Rd
- 3877 Thomas Cross Rd
- 619 Old Thomas Byrd Rd
- TBD Old Thomas Bryd Rd
- 100 Thomas Cross Rd Off
- 3845 Thomas Cross Rd
- 3821 Thomas Cross Rd
- 3873 Thomas Cross Rd
- 3835 Thomas Cross Rd
- 3838 Thomas Cross Rd
- 3928 Thomas Cross Rd
- 3805 Thomas Cross Rd
- 650 Mountain High Trail
- 3915 Thomas Cross Rd
- 586 Mountain High Trail
- 436 Mary Ruth Way
- 416 Mary Ruth Way
- 450 Mary Ruth Way
- 658 Mountain High Trail
Your Personal Tour Guide
Ask me questions while you tour the home.