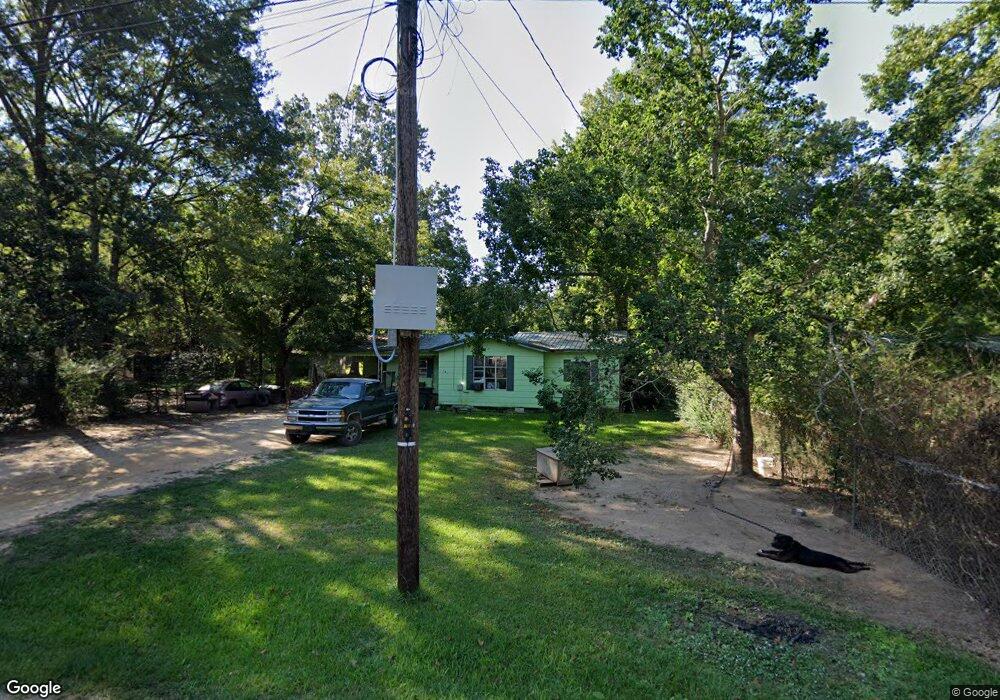
387 Binns Loop Crossett, AR 71635
Estimated Value: $47,178 - $118,000
Studio
1
Bath
904
Sq Ft
$95/Sq Ft
Est. Value
About This Home
This home is located at 387 Binns Loop, Crossett, AR 71635 and is currently estimated at $86,295, approximately $95 per square foot. 387 Binns Loop is a home located in Ashley County with nearby schools including Crossett Elementary School, Crossett Middle School, and Crossett High School.
Ownership History
Date
Name
Owned For
Owner Type
Purchase Details
Closed on
Oct 21, 2001
Bought by
Pam Jessie and Pam Faye S
Current Estimated Value
Purchase Details
Closed on
Oct 18, 2001
Bought by
Crossett Paper Mills Employees and Federal Credit Union
Purchase Details
Closed on
Nov 3, 1999
Bought by
Franklin Charles and La Shanda
Purchase Details
Closed on
Feb 5, 1999
Bought by
Nelms Ricky and Nelms Paula
Purchase Details
Closed on
Aug 14, 1998
Bought by
Tyler Bradley A
Purchase Details
Closed on
Jan 21, 1986
Bought by
Parnell Claude L and Parnell Margaret
Purchase Details
Closed on
Jun 7, 1985
Bought by
United States Of America
Purchase Details
Closed on
Dec 1, 1977
Bought by
Avery David E and Avery Amy A
Purchase Details
Closed on
Jul 1, 1975
Bought by
Prothro Jerry W and Prothro Janet M
Purchase Details
Closed on
Apr 16, 1975
Bought by
Frisby John and Rose Marie
Purchase Details
Closed on
Mar 16, 1970
Bought by
Frisby John A and Rose Marie
Create a Home Valuation Report for This Property
The Home Valuation Report is an in-depth analysis detailing your home's value as well as a comparison with similar homes in the area
Home Values in the Area
Average Home Value in this Area
Purchase History
| Date | Buyer | Sale Price | Title Company |
|---|---|---|---|
| Pam Jessie | $28,000 | -- | |
| Crossett Paper Mills Employees | -- | -- | |
| Franklin Charles | $28,000 | -- | |
| Nelms Ricky | $20,000 | -- | |
| Tyler Bradley A | $4,000 | -- | |
| Parnell Claude L | $9,500 | -- | |
| United States Of America | -- | -- | |
| Avery David E | -- | -- | |
| Prothro Jerry W | -- | -- | |
| Frisby John | -- | -- | |
| Frisby John A | -- | -- |
Source: Public Records
Tax History
| Year | Tax Paid | Tax Assessment Tax Assessment Total Assessment is a certain percentage of the fair market value that is determined by local assessors to be the total taxable value of land and additions on the property. | Land | Improvement |
|---|---|---|---|---|
| 2025 | $278 | $7,010 | $260 | $6,750 |
| 2024 | $256 | $7,010 | $260 | $6,750 |
| 2023 | $235 | $7,010 | $260 | $6,750 |
| 2022 | $214 | $4,520 | $240 | $4,280 |
| 2021 | $196 | $4,520 | $240 | $4,280 |
| 2020 | $196 | $4,520 | $240 | $4,280 |
| 2019 | $196 | $4,520 | $240 | $4,280 |
| 2018 | $0 | $4,520 | $240 | $4,280 |
| 2017 | $0 | $4,520 | $240 | $4,280 |
| 2016 | $196 | $4,520 | $240 | $4,280 |
| 2015 | $196 | $4,520 | $240 | $4,280 |
| 2014 | $196 | $4,520 | $240 | $4,280 |
Source: Public Records
Map
Nearby Homes
- 1710 Gardenia St
- 1492 Highway 52 W
- 186 E Pierce St
- 293 Ashley 491 Rd
- 1436 Mimosa St
- 210 Willis St
- 0 Ashley Rd Unit 25018760
- 0 Ashley Road 20
- 905 Patton Dr
- 267 Ashley Road 16
- 000 Fairview Rd Hwy 133 N
- 600 Patton Dr
- 0 Ashley 461
- 145 Unity Ln
- 402 Elm St
- 702 Pecan St
- 2903 Brooks Rd
- 711 Maple St
- 506 N Carolina St
- 308 N Mississippi St
- 383 Binns Loop
- 391 Binns Loop
- 388 Binns Loop
- 106 Fagen Elton Rd
- 377 Binns Loop
- 373 Binns Loop
- 110 Fagen Elton Rd
- 369 Binns Loop
- 111 Miles Rd
- 121 Frisby Rd
- 117 Fagen Elton Rd
- 120 Miles Rd
- 359 Binns Loop
- 130 Frisby Rd
- 101 Cope St
- 119 Fagen Elton Rd
- 423 Binns Loop
- 129 Miles Rd
- 426 Binns Loop
- 125 Cope St
Your Personal Tour Guide
Ask me questions while you tour the home.