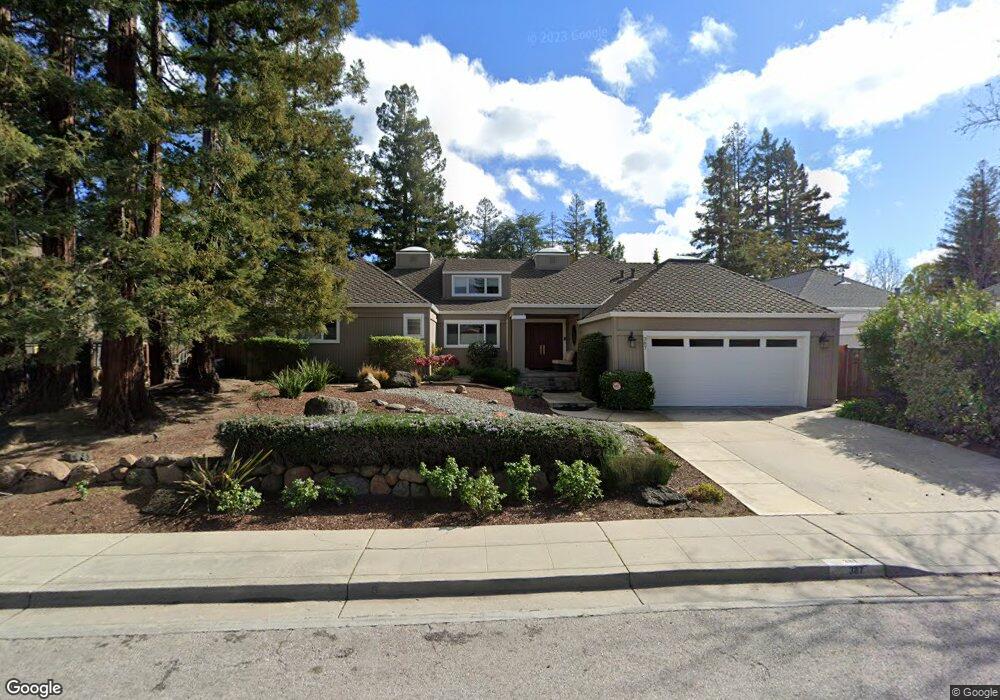
387 Foxborough Dr Mountain View, CA 94041
Estimated Value: $3,290,000 - $3,692,942
4
Beds
4
Baths
2,753
Sq Ft
$1,272/Sq Ft
Est. Value
About This Home
This home is located at 387 Foxborough Dr, Mountain View, CA 94041 and is currently estimated at $3,501,986, approximately $1,272 per square foot. 387 Foxborough Dr is a home located in Santa Clara County with nearby schools including Edith Landels Elementary School, Isaac Newton Graham Middle School, and Mountain View High School.
Ownership History
Date
Name
Owned For
Owner Type
Purchase Details
Closed on
May 14, 2009
Sold by
Balram Nikhil and Balram Sangeeta Nikhil
Bought by
Balram Nikhil and Balram Sangeeta Nikhil
Current Estimated Value
Home Financials for this Owner
Home Financials are based on the most recent Mortgage that was taken out on this home.
Original Mortgage
$330,000
Interest Rate
4.8%
Mortgage Type
New Conventional
Purchase Details
Closed on
Aug 25, 2007
Sold by
Balram Nikhil and Balram Sangeeta
Bought by
Balram Nikhil and Balram Sangeeta Nikhil
Purchase Details
Closed on
Apr 23, 1998
Sold by
Sumner Carol J and Sumner Carol J
Bought by
Balram Nikhil and Balram Sangeeta
Home Financials for this Owner
Home Financials are based on the most recent Mortgage that was taken out on this home.
Original Mortgage
$420,000
Interest Rate
7.13%
Purchase Details
Closed on
Feb 25, 1995
Sold by
Fowler Terry
Bought by
Sumner Carol J
Create a Home Valuation Report for This Property
The Home Valuation Report is an in-depth analysis detailing your home's value as well as a comparison with similar homes in the area
Purchase History
| Date | Buyer | Sale Price | Title Company |
|---|---|---|---|
| Balram Nikhil | -- | Accommodation | |
| Balram Nikhil | -- | Chicago Title Company | |
| Balram Nikhil | -- | None Available | |
| Balram Nikhil | $525,000 | Old Republic Title Company | |
| Sumner Carol J | -- | -- |
Source: Public Records
Mortgage History
| Date | Status | Borrower | Loan Amount |
|---|---|---|---|
| Closed | Balram Nikhil | $330,000 | |
| Closed | Balram Nikhil | $420,000 |
Source: Public Records
Tax History
| Year | Tax Paid | Tax Assessment Tax Assessment Total Assessment is a certain percentage of the fair market value that is determined by local assessors to be the total taxable value of land and additions on the property. | Land | Improvement |
|---|---|---|---|---|
| 2025 | $12,417 | $1,072,850 | $419,144 | $653,706 |
| 2024 | $12,417 | $1,051,815 | $410,926 | $640,889 |
| 2023 | $12,289 | $1,031,192 | $402,869 | $628,323 |
| 2022 | $12,254 | $1,010,973 | $394,970 | $616,003 |
| 2021 | $11,954 | $991,151 | $387,226 | $603,925 |
| 2020 | $11,969 | $980,989 | $383,256 | $597,733 |
| 2019 | $11,465 | $961,755 | $375,742 | $586,013 |
| 2018 | $11,344 | $942,898 | $368,375 | $574,523 |
| 2017 | $10,875 | $924,410 | $361,152 | $563,258 |
| 2016 | $10,681 | $906,285 | $354,071 | $552,214 |
| 2015 | $10,377 | $892,673 | $348,753 | $543,920 |
| 2014 | $10,283 | $875,188 | $341,922 | $533,266 |
Source: Public Records
Map
Nearby Homes
- 411 Hedgerow Ct
- 433 Sylvan Ave Unit 120
- 433 Sylvan Ave Unit 84
- 433 Sylvan Ave Unit 134
- 501 Moorpark Way Unit 65
- 325 Sylvan Ave Unit 23
- 325 Sylvan Ave
- 365 Shelby Dr
- 451 Chagall St
- 1248 Cortez Dr
- 1241 Coronado Dr
- 1237 Coronado Dr
- 465 Bedford Loop
- 159 Irene Ct
- 111 Nancy Ct
- 171 Bel Air Ct
- 136 Avellino Way
- 248 S Bernardo Ave
- 181 Ada Ave Unit 50
- 191 E El Camino Real Unit 138
- 391 Foxborough Dr
- 385 Foxborough Dr
- 399 Hedgerow Ct
- 397 Hedgerow Ct
- 381 Foxborough Dr
- 395 Hedgerow Ct
- 406 Foxborough Dr
- 410 Foxborough Dr
- 401 Hedgerow Ct
- 402 Foxborough Dr
- 377 Foxborough Dr
- 414 Foxborough Dr
- 398 Foxborough Dr
- 403 Hedgerow Ct
- 394 Foxborough Dr
- 425 Hedgerow Ct
- 421 Hedgerow Ct
- 419 Hedgerow Ct
- 423 Hedgerow Ct
- 373 Foxborough Dr
Your Personal Tour Guide
Ask me questions while you tour the home.