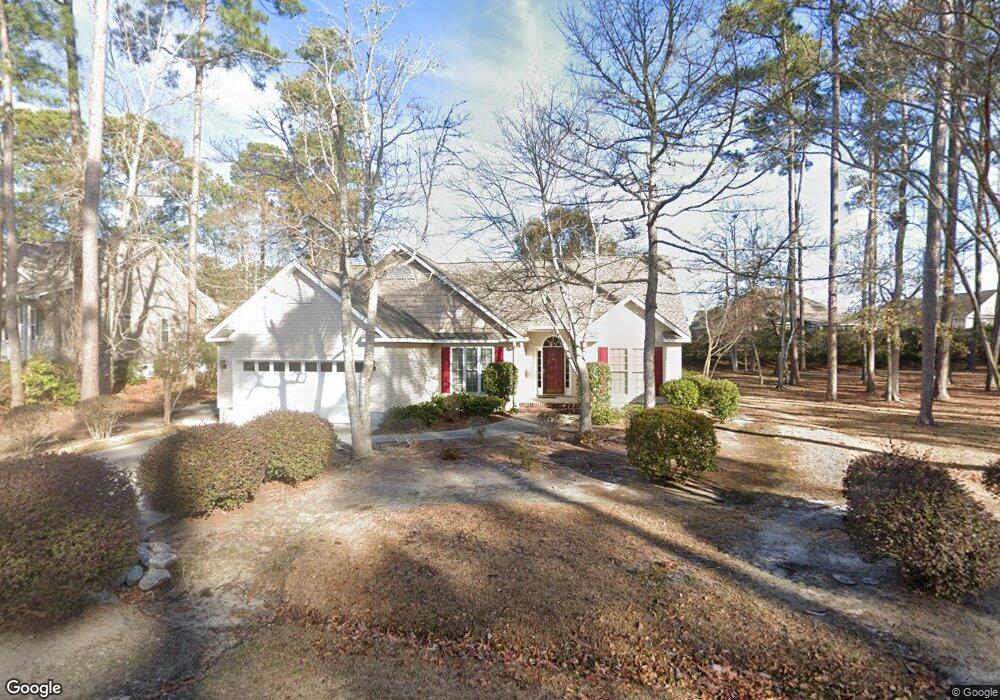
3870 Timber Stream Dr Southport, NC 28461
Estimated Value: $447,516 - $547,000
3
Beds
2
Baths
1,701
Sq Ft
$282/Sq Ft
Est. Value
About This Home
This home is located at 3870 Timber Stream Dr, Southport, NC 28461 and is currently estimated at $479,129, approximately $281 per square foot. 3870 Timber Stream Dr is a home located in Brunswick County with nearby schools including Virginia Williamson Elementary School, South Brunswick Middle School, and South Brunswick High School.
Ownership History
Date
Name
Owned For
Owner Type
Purchase Details
Closed on
Oct 13, 2011
Sold by
Callaghan John J and Loraine Callaghan E
Bought by
Delair Ronald H and Delair Diane L
Current Estimated Value
Purchase Details
Closed on
Jun 30, 2009
Sold by
Beaver Dam Partners Llc
Bought by
Callaghan John J
Home Financials for this Owner
Home Financials are based on the most recent Mortgage that was taken out on this home.
Original Mortgage
$150,000
Interest Rate
4.79%
Mortgage Type
Purchase Money Mortgage
Purchase Details
Closed on
Jun 19, 2009
Sold by
Bank Of America Na
Bought by
Callaghan John J
Home Financials for this Owner
Home Financials are based on the most recent Mortgage that was taken out on this home.
Original Mortgage
$150,000
Interest Rate
4.79%
Mortgage Type
Purchase Money Mortgage
Purchase Details
Closed on
Feb 18, 2009
Sold by
Braught Harvey B and Braught Lea F
Bought by
Bank Of America Na
Create a Home Valuation Report for This Property
The Home Valuation Report is an in-depth analysis detailing your home's value as well as a comparison with similar homes in the area
Home Values in the Area
Average Home Value in this Area
Purchase History
| Date | Buyer | Sale Price | Title Company |
|---|---|---|---|
| Delair Ronald H | $250,000 | None Available | |
| Callaghan John J | -- | None Available | |
| Callaghan John J | $195,000 | None Available | |
| Bank Of America Na | -- | None Available |
Source: Public Records
Mortgage History
| Date | Status | Borrower | Loan Amount |
|---|---|---|---|
| Previous Owner | Callaghan John J | $150,000 |
Source: Public Records
Tax History Compared to Growth
Tax History
| Year | Tax Paid | Tax Assessment Tax Assessment Total Assessment is a certain percentage of the fair market value that is determined by local assessors to be the total taxable value of land and additions on the property. | Land | Improvement |
|---|---|---|---|---|
| 2025 | $0 | $408,690 | $106,000 | $302,690 |
| 2024 | $1,699 | $408,690 | $106,000 | $302,690 |
| 2023 | $1,570 | $408,690 | $106,000 | $302,690 |
| 2022 | $0 | $272,930 | $80,000 | $192,930 |
| 2021 | $1,292 | $272,930 | $80,000 | $192,930 |
| 2020 | $0 | $272,930 | $80,000 | $192,930 |
| 2019 | $1,558 | $83,260 | $80,000 | $3,260 |
| 2018 | $1,317 | $67,750 | $64,000 | $3,750 |
| 2017 | $1,317 | $67,750 | $64,000 | $3,750 |
| 2016 | $1,292 | $67,750 | $64,000 | $3,750 |
| 2015 | $1,292 | $227,020 | $64,000 | $163,020 |
| 2014 | $1,058 | $198,492 | $47,250 | $151,242 |
Source: Public Records
Map
Nearby Homes
- 4490 Millwright Cir
- 4510 Fieldstone Cir
- 3838 Winding Vine Way
- 3712 Fairfield Way
- 4135 Skeffington Ct
- 3705 Fairfield Way
- 4481 Regency Crossing
- 3973 Pepperberry Ln
- 3965 Pepperberry Ln
- 3882 White Blossom Cir
- 3914 Meeting Place
- 3918 Meeting Place Ln
- 3905 Meeting Place
- 3803 Harmony Cir
- Isla Plan at Arbor Creek
- Laurel Plan at Arbor Creek
- Palm Plan at Arbor Creek
- Danforth Plan at Arbor Creek
- 3565 Saint James Dr SE
- 3923 Harmony Cir
- 3866 Timber Stream Dr
- 3715 Pond Pine Ct
- 3874 Timber Stream Dr
- 3854 Timber Stream Dr
- 3849 Timber Stream Dr
- 3717 Pond Pine Ct
- 3713 Pond Pine Ct
- 3869 Timber Stream Dr
- 3878 Timber Stream Dr
- 3862 Timber Stream Dr
- 3719 Pond Pine Ct
- 3711 Pond Pine Ct
- 3721 Pond Pine Ct
- 3886 Timber Stream Dr
- 3865 Timber Stream Dr
- 3873 Timber Stream Dr
- 3858 Timber Stream Dr
- 3861 Timber Stream Dr
- 3709 Pond Pine Ct
- 3712 Pond Pine Ct