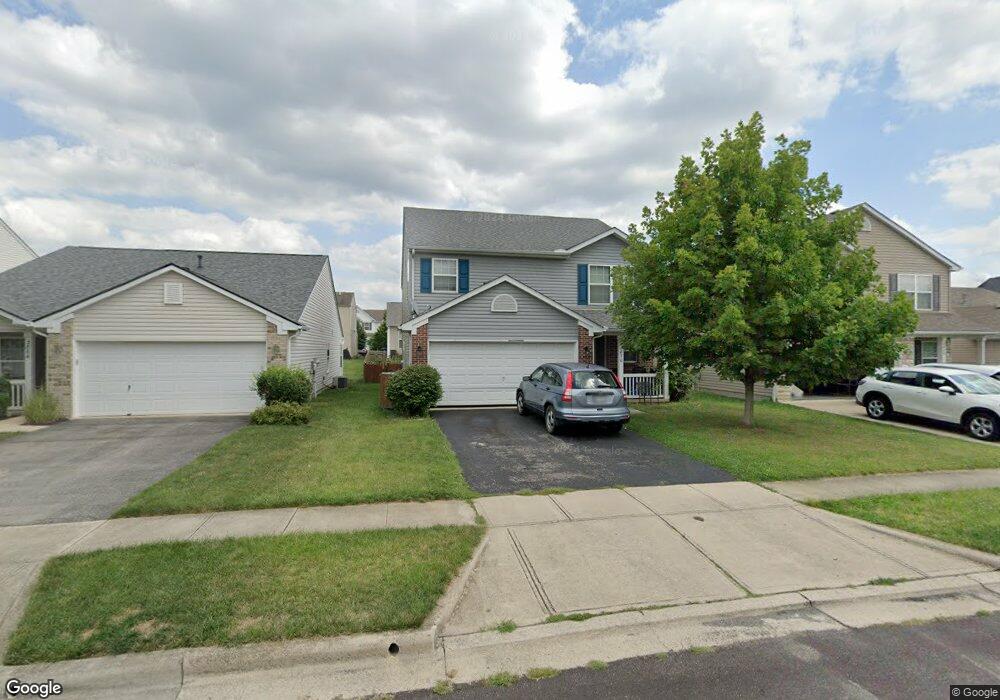
3870 Winding Twig Dr Unit AT116 Canal Winchester, OH 43110
Abbie Trails NeighborhoodEstimated Value: $295,000 - $332,000
3
Beds
3
Baths
1,689
Sq Ft
$189/Sq Ft
Est. Value
About This Home
This home is located at 3870 Winding Twig Dr Unit AT116, Canal Winchester, OH 43110 and is currently estimated at $319,748, approximately $189 per square foot. 3870 Winding Twig Dr Unit AT116 is a home located in Franklin County with nearby schools including Groveport Madison High School and Brice Christian Academy Elementary School.
Ownership History
Date
Name
Owned For
Owner Type
Purchase Details
Closed on
Dec 6, 2019
Sold by
Pantouw Rio R and Herdiani Dewi
Bought by
Djigo Fatimata
Current Estimated Value
Home Financials for this Owner
Home Financials are based on the most recent Mortgage that was taken out on this home.
Original Mortgage
$176,739
Outstanding Balance
$155,109
Interest Rate
3.37%
Mortgage Type
FHA
Estimated Equity
$164,639
Purchase Details
Closed on
Jan 19, 2016
Sold by
Long Eric M
Bought by
Dewi Pantouw Rio R and Dewi Herdiani
Home Financials for this Owner
Home Financials are based on the most recent Mortgage that was taken out on this home.
Original Mortgage
$129,609
Interest Rate
4.37%
Mortgage Type
FHA
Purchase Details
Closed on
Jul 15, 2008
Sold by
Beazer Homes Investments Llc
Bought by
Long Eric M
Home Financials for this Owner
Home Financials are based on the most recent Mortgage that was taken out on this home.
Original Mortgage
$117,760
Interest Rate
6.5%
Mortgage Type
VA
Create a Home Valuation Report for This Property
The Home Valuation Report is an in-depth analysis detailing your home's value as well as a comparison with similar homes in the area
Home Values in the Area
Average Home Value in this Area
Purchase History
| Date | Buyer | Sale Price | Title Company |
|---|---|---|---|
| Djigo Fatimata | $180,000 | Northwest Advantage Ttl Agcy | |
| Dewi Pantouw Rio R | $132,000 | Attorney | |
| Long Eric M | $115,000 | Preferred T |
Source: Public Records
Mortgage History
| Date | Status | Borrower | Loan Amount |
|---|---|---|---|
| Open | Djigo Fatimata | $176,739 | |
| Previous Owner | Dewi Pantouw Rio R | $129,609 | |
| Previous Owner | Long Eric M | $117,760 |
Source: Public Records
Tax History Compared to Growth
Tax History
| Year | Tax Paid | Tax Assessment Tax Assessment Total Assessment is a certain percentage of the fair market value that is determined by local assessors to be the total taxable value of land and additions on the property. | Land | Improvement |
|---|---|---|---|---|
| 2024 | $4,279 | $100,910 | $25,730 | $75,180 |
| 2023 | $4,238 | $100,905 | $25,725 | $75,180 |
| 2022 | $3,192 | $63,220 | $9,350 | $53,870 |
| 2021 | $3,202 | $63,220 | $9,350 | $53,870 |
| 2020 | $3,207 | $63,220 | $9,350 | $53,870 |
| 2019 | $3,140 | $55,370 | $8,120 | $47,250 |
| 2018 | $2,959 | $55,370 | $8,120 | $47,250 |
| 2017 | $3,170 | $55,370 | $8,120 | $47,250 |
| 2016 | $2,728 | $43,550 | $7,950 | $35,600 |
| 2015 | $2,758 | $43,550 | $7,950 | $35,600 |
| 2014 | $2,789 | $43,550 | $7,950 | $35,600 |
| 2013 | $1,167 | $43,540 | $7,945 | $35,595 |
Source: Public Records
Map
Nearby Homes
- 7505 Winding Path Ct
- 7449 Sugarbark Ct
- 7490 Sugarbark Ct
- 3682 Winding Path Dr
- 3878 Willow Branch Dr
- 3972 Bannen Trail Dr
- 6865 Manor Crest Ln
- 4028 Boyer Ridge Dr
- 3624 Peany Ln
- 3535 Wheatfield Dr
- 0 Refugee Rd
- 165 Norland Dr
- 6747 Dorothys Crossing Unit 6747
- 6800 Barker Dr
- 7287 Candlestone Dr
- 3265 O'Heagra Dr
- 6523 Dorothys Creek
- 3358 Cargin Ct
- 165 Lorrimore Dr
- 165 Balderson Dr
- 3870 Winding Twig Dr
- 3876 Winding Twig Dr
- 3864 Winding Twig Dr
- 3858 Winding Twig Dr
- 3858 Winding Twig Dr Unit AT114
- 3882 Winding Twig Dr
- 3882 Winding Twig Dr Unit AT118
- 3865 Winding Path Dr Unit AT149
- 3865 Winding Path Dr
- 3871 Winding Path Dr Unit AT148
- 3871 Winding Path Dr
- 3859 Winding Path Dr
- 3859 Winding Path Dr Unit 150
- 3888 Winding Twig Dr
- 3888 Winding Twig Dr Unit AT119
- 3852 Winding Twig Dr
- 3852 Winding Twig Dr
- 3852 Winding Twig Dr Unit 113AT
- 3877 Winding Path Dr
- 3869 Winding Twig Dr Unit AT128