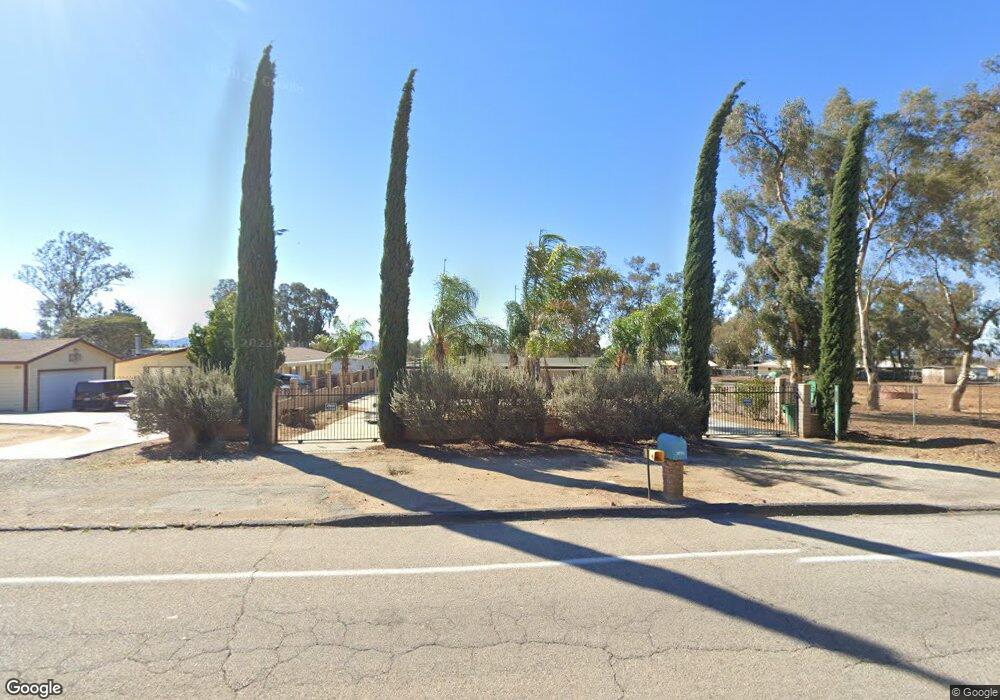
38701 Cherry Valley Blvd Cherry Valley, CA 92223
Estimated Value: $259,000 - $491,000
2
Beds
2
Baths
1,335
Sq Ft
$312/Sq Ft
Est. Value
About This Home
This home is located at 38701 Cherry Valley Blvd, Cherry Valley, CA 92223 and is currently estimated at $416,813, approximately $312 per square foot. 38701 Cherry Valley Blvd is a home located in Riverside County with nearby schools including Brookside Elementary School, Mountain View Middle School, and Beaumont Senior High School.
Ownership History
Date
Name
Owned For
Owner Type
Purchase Details
Closed on
Jan 17, 2019
Sold by
Nava Jose G and Nava Irma
Bought by
Nava Irma
Current Estimated Value
Purchase Details
Closed on
Jun 25, 2010
Sold by
Kondaur Capital Corporation
Bought by
Nava Jose G and Nava Irma
Purchase Details
Closed on
May 4, 2010
Sold by
Rodriguez Reyes A and Rodriguez Juanita
Bought by
Kondaur Capital Corporation
Purchase Details
Closed on
Apr 10, 2003
Sold by
Herring Doris J
Bought by
Rodriguez Reyes A and Rodriguez Juanita
Home Financials for this Owner
Home Financials are based on the most recent Mortgage that was taken out on this home.
Original Mortgage
$50,000
Interest Rate
6.06%
Mortgage Type
Seller Take Back
Purchase Details
Closed on
Mar 25, 2003
Sold by
Herring William R and Herring Doris J
Bought by
Herring Doris J
Home Financials for this Owner
Home Financials are based on the most recent Mortgage that was taken out on this home.
Original Mortgage
$50,000
Interest Rate
6.06%
Mortgage Type
Seller Take Back
Create a Home Valuation Report for This Property
The Home Valuation Report is an in-depth analysis detailing your home's value as well as a comparison with similar homes in the area
Home Values in the Area
Average Home Value in this Area
Purchase History
| Date | Buyer | Sale Price | Title Company |
|---|---|---|---|
| Nava Irma | -- | None Available | |
| Nava Jose G | $70,000 | Ticor Title Company Of Ca | |
| Kondaur Capital Corporation | $148,000 | National Itel Ins Of Ny Inc | |
| Rodriguez Reyes A | $164,909 | Chicago Title Co | |
| Herring Doris J | -- | -- |
Source: Public Records
Mortgage History
| Date | Status | Borrower | Loan Amount |
|---|---|---|---|
| Previous Owner | Rodriguez Reyes A | $50,000 |
Source: Public Records
Tax History
| Year | Tax Paid | Tax Assessment Tax Assessment Total Assessment is a certain percentage of the fair market value that is determined by local assessors to be the total taxable value of land and additions on the property. | Land | Improvement |
|---|---|---|---|---|
| 2025 | $1,205 | $89,667 | $57,391 | $32,276 |
| 2023 | $1,205 | $86,187 | $55,163 | $31,024 |
| 2022 | $1,413 | $84,498 | $54,082 | $30,416 |
| 2021 | $1,165 | $82,842 | $53,022 | $29,820 |
| 2020 | $1,151 | $81,994 | $52,479 | $29,515 |
| 2019 | $1,134 | $80,387 | $51,450 | $28,937 |
| 2018 | $1,129 | $78,812 | $50,441 | $28,371 |
| 2017 | $1,110 | $77,267 | $49,452 | $27,815 |
| 2016 | $1,081 | $75,753 | $48,483 | $27,270 |
| 2015 | $1,063 | $74,616 | $47,755 | $26,861 |
| 2014 | $1,064 | $73,156 | $46,820 | $26,336 |
Source: Public Records
Map
Nearby Homes
- 38535 Vineland St
- 39068 Vineland St
- 805 Annandale Rd
- 9870 Nancy Ave
- 860 Annandale Rd
- 38239 Orchard St
- 38011 Vineland St
- 1764 Muirfield Ln
- 10007 Beaumont Ave
- 10132 Taylor Dr
- 1771 N Forest Oaks Dr
- 1760 Scottsdale Rd
- 10410 Live Oak Ave
- 38608 Pass View Dr
- 9678 Slope Ave
- 9728 Mountain View Ave
- 9710 Mountain View Ave
- 785 Pine Ridge Cir
- 728 Indigo St
- 1729 Scottsdale Rd
- 38705 Cherry Valley Blvd
- 38678 Cherry Valley Blvd
- 38649 Cherry Valley Blvd
- 38745 Cherry Valley Blvd
- 38690 Cherry Valley Blvd
- 38656 Cherry Valley Blvd
- 38648 Cherry Valley Blvd
- 38756 Cherry Valley Blvd
- 38634 Cherry Valley Blvd
- 10610 Virginia Ln
- 38790 Cherry Valley Blvd
- 38620 Cherry Valley Blvd
- 38610 Cherry Valley Blvd
- 10650 Virginia Ln
- 38834 Cherry Valley Blvd
- 38850 Cherry Valley Blvd
- 38520 Cherry Valley Blvd
- 38865 Cherry Valley Blvd
- 10698 Virginia Ln
- 10434 Nancy Ave
Your Personal Tour Guide
Ask me questions while you tour the home.