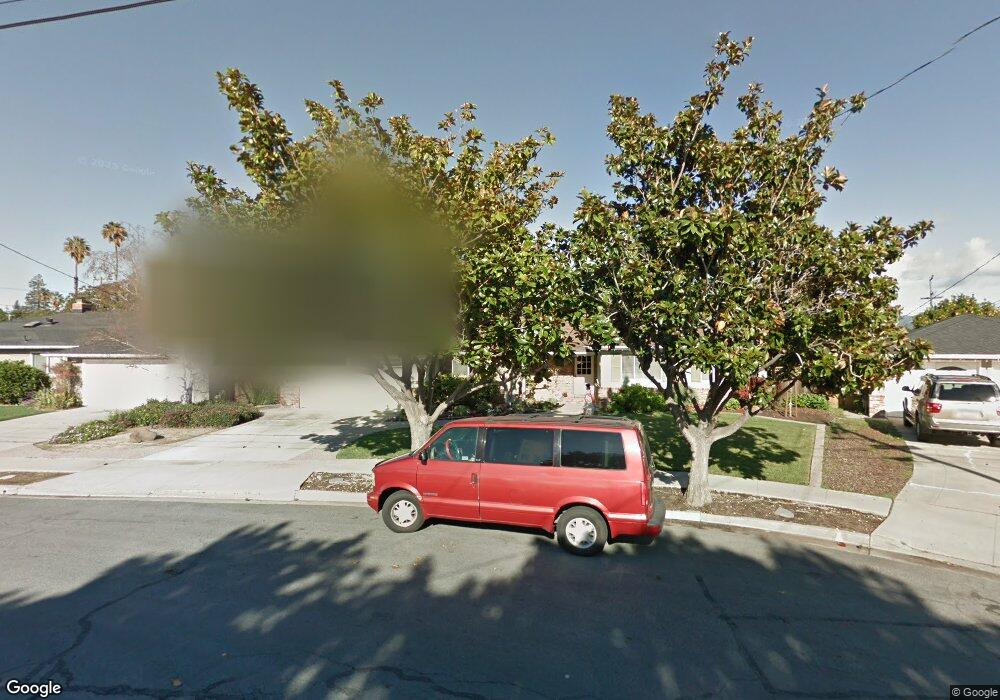
38716 Northdale Cir Fremont, CA 94536
Glenmoor NeighborhoodEstimated Value: $1,747,000 - $2,032,000
3
Beds
3
Baths
1,950
Sq Ft
$950/Sq Ft
Est. Value
About This Home
This home is located at 38716 Northdale Cir, Fremont, CA 94536 and is currently estimated at $1,852,433, approximately $949 per square foot. 38716 Northdale Cir is a home located in Alameda County with nearby schools including Glenmoor Elementary School, Centerville Junior High School, and Washington High School.
Ownership History
Date
Name
Owned For
Owner Type
Purchase Details
Closed on
Dec 7, 2020
Sold by
Smith Garth W and Smith Barry H
Bought by
Smith Garth W and Smith Robin M
Current Estimated Value
Purchase Details
Closed on
Aug 28, 2001
Sold by
Smith Elinor V
Bought by
Smith Elinor V and The Elinor V Smith Family Trus
Home Financials for this Owner
Home Financials are based on the most recent Mortgage that was taken out on this home.
Original Mortgage
$100,000
Interest Rate
7.05%
Purchase Details
Closed on
Nov 9, 1993
Sold by
Smith Elinor V
Bought by
Smith Elinor V
Home Financials for this Owner
Home Financials are based on the most recent Mortgage that was taken out on this home.
Original Mortgage
$192,000
Interest Rate
6.91%
Purchase Details
Closed on
Nov 3, 1993
Sold by
Smith Elinor V
Bought by
Smith Elinor V
Home Financials for this Owner
Home Financials are based on the most recent Mortgage that was taken out on this home.
Original Mortgage
$192,000
Interest Rate
6.91%
Create a Home Valuation Report for This Property
The Home Valuation Report is an in-depth analysis detailing your home's value as well as a comparison with similar homes in the area
Home Values in the Area
Average Home Value in this Area
Purchase History
| Date | Buyer | Sale Price | Title Company |
|---|---|---|---|
| Smith Garth W | -- | None Available | |
| Smith Garth W | -- | None Available | |
| Smith Elinor V | -- | -- | |
| Smith Elinor V | -- | Chicago Title Co | |
| Smith Elinor V | -- | Gateway Title Company | |
| Smith Elinor V | -- | World Title Co |
Source: Public Records
Mortgage History
| Date | Status | Borrower | Loan Amount |
|---|---|---|---|
| Closed | Smith Elinor V | $100,000 | |
| Previous Owner | Smith Elinor V | $192,000 |
Source: Public Records
Tax History Compared to Growth
Tax History
| Year | Tax Paid | Tax Assessment Tax Assessment Total Assessment is a certain percentage of the fair market value that is determined by local assessors to be the total taxable value of land and additions on the property. | Land | Improvement |
|---|---|---|---|---|
| 2025 | $2,171 | $121,522 | $30,034 | $91,488 |
| 2024 | $2,171 | $119,139 | $29,445 | $89,694 |
| 2023 | $2,094 | $116,804 | $28,868 | $87,936 |
| 2022 | $2,040 | $114,514 | $28,302 | $86,212 |
| 2021 | $1,998 | $112,268 | $27,747 | $84,521 |
| 2020 | $1,914 | $111,117 | $27,462 | $83,655 |
| 2019 | $1,897 | $108,939 | $26,924 | $82,015 |
| 2018 | $1,775 | $106,803 | $26,396 | $80,407 |
| 2017 | $1,731 | $104,709 | $25,879 | $78,830 |
| 2016 | $1,686 | $102,656 | $25,371 | $77,285 |
| 2015 | $1,649 | $101,114 | $24,990 | $76,124 |
| 2014 | $1,609 | $99,134 | $24,501 | $74,633 |
Source: Public Records
Map
Nearby Homes
- 4754 Northdale Dr
- 4715 Eggers Dr
- 38324 Blacow Rd
- 4328 Cognina Ct
- 4586 Norris Rd
- 4237 Garland Dr
- 4714 Serra Ave
- 37987 Alta Dr
- 38265 Corrigan Ct
- 37721 Madera Ct
- 39090 Presidio Way Unit 237
- 37621 Glenmoor Dr
- 5169 Lawler Ave
- 37792 Colfax Ct
- 5033 Blacksand Rd
- 38837 Fremont Blvd
- 39530 Dorrington Ct
- 5268 Keeler Ct
- 5516 Higo Way
- 5513 Higo Way
- 4650 Northdale Dr
- 38732 Northdale Cir
- 38663 Glenmoor Dr
- 4630 Northdale Dr
- 38679 Glenmoor Dr
- 38729 Northdale Cir
- 4680 Northdale Dr
- 38713 Northdale Cir
- 4604 Northdale Dr
- 38723 Glenmoor Dr
- 4655 Northdale Dr
- 4641 Northdale Dr
- 4637 Richmond Ave
- 4669 Northdale Dr
- 4649 Richmond Ave
- 4625 Northdale Dr
- 4591 Odell Ct
- 4706 Northdale Dr
- 4661 Richmond Ave
- 4625 Richmond Ave