Estimated Value: $253,000 - $268,000
2
Beds
3
Baths
1,580
Sq Ft
$164/Sq Ft
Est. Value
About This Home
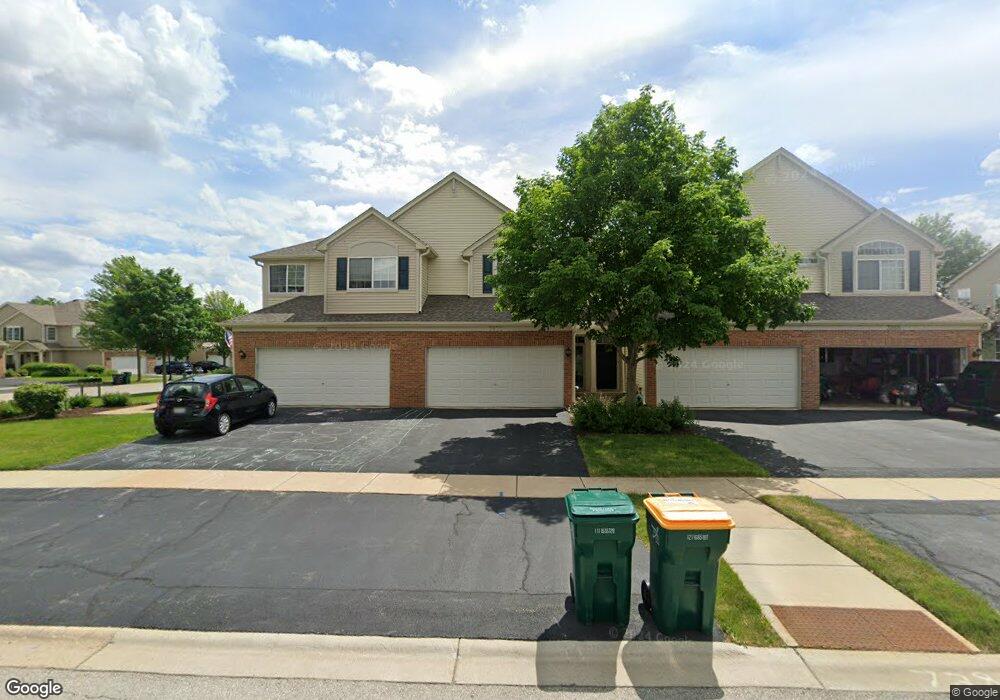
This home is located at 3872 Munson St Unit 2, Plano, IL 60545 and is currently estimated at $258,744, approximately $163 per square foot. 3872 Munson St Unit 2 is a home located in Kendall County with nearby schools including P.H. Miller Elementary School, Emily G. Johns School, and Centennial Elementary School.
Ownership History
Date
Name
Owned For
Owner Type
Purchase Details
Closed on
May 5, 2023
Sold by
Turner Karen
Bought by
Pisano Nicholas
Current Estimated Value
Home Financials for this Owner
Home Financials are based on the most recent Mortgage that was taken out on this home.
Original Mortgage
$165,600
Interest Rate
6.5%
Mortgage Type
New Conventional
Purchase Details
Closed on
Sep 29, 2016
Sold by
Repp Katie
Bought by
Turner Karen
Purchase Details
Closed on
Sep 11, 2014
Sold by
Secretary Of Housing & Urban Development
Bought by
Repp Katie
Home Financials for this Owner
Home Financials are based on the most recent Mortgage that was taken out on this home.
Original Mortgage
$82,030
Interest Rate
4.12%
Mortgage Type
FHA
Purchase Details
Closed on
Oct 10, 2013
Sold by
Hanley Tyler L
Bought by
The Secretary Of Housing & Urban Develop
Purchase Details
Closed on
Oct 31, 2008
Sold by
The Ryland Group Inc
Bought by
Hanley Tyler L
Home Financials for this Owner
Home Financials are based on the most recent Mortgage that was taken out on this home.
Original Mortgage
$137,020
Interest Rate
6.49%
Mortgage Type
FHA
Create a Home Valuation Report for This Property
The Home Valuation Report is an in-depth analysis detailing your home's value as well as a comparison with similar homes in the area
Home Values in the Area
Average Home Value in this Area
Purchase History
| Date | Buyer | Sale Price | Title Company |
|---|---|---|---|
| Pisano Nicholas | $207,000 | Chicago Title | |
| Turner Karen | $115,000 | Attorney | |
| Repp Katie | $80,500 | Fidelity National Title | |
| The Secretary Of Housing & Urban Develop | -- | None Available | |
| Hanley Tyler L | $139,500 | Ryland Title Company |
Source: Public Records
Mortgage History
| Date | Status | Borrower | Loan Amount |
|---|---|---|---|
| Previous Owner | Pisano Nicholas | $165,600 | |
| Previous Owner | Repp Katie | $82,030 | |
| Previous Owner | Hanley Tyler L | $137,020 |
Source: Public Records
Tax History
| Year | Tax Paid | Tax Assessment Tax Assessment Total Assessment is a certain percentage of the fair market value that is determined by local assessors to be the total taxable value of land and additions on the property. | Land | Improvement |
|---|---|---|---|---|
| 2024 | $6,685 | $69,039 | $6,334 | $62,705 |
| 2023 | $0 | $61,406 | $5,634 | $55,772 |
| 2022 | $6,071 | $54,396 | $4,991 | $49,405 |
| 2021 | $5,642 | $49,546 | $4,546 | $45,000 |
| 2020 | $5,661 | $48,575 | $4,457 | $44,118 |
| 2019 | $5,604 | $47,107 | $4,274 | $42,833 |
| 2018 | $5,314 | $41,843 | $4,071 | $37,772 |
| 2017 | $5,231 | $38,409 | $4,071 | $34,338 |
| 2016 | $4,366 | $33,930 | $4,071 | $29,859 |
| 2015 | $3,952 | $27,547 | $3,274 | $24,273 |
| 2014 | -- | $24,292 | $3,000 | $21,292 |
| 2013 | -- | $24,292 | $3,301 | $20,991 |
Source: Public Records
Map
Nearby Homes
- 3919 Pratt St Unit 7262
- 3863 Munson St Unit 7084
- 4118 Klatt St Unit 3A
- 4124 Dobbins St
- 4407 Klatt St
- 11948 Andrew St
- 3305 Paige St Unit 2A
- 114 Schmidt Ct
- 3311 Edward St
- Lot 11 Ashley Ln
- 3304 Alyssa St Unit 2A
- 2913 Alyssa St
- 2824 Hoffman St
- 313 Waubonsee Dr
- 4132 Hoffman St
- 706 Keller St
- 711 Osbron St
- 1517 Stoneridge Ct Unit 3
- 1415 Cottonwood Trail
- 1413 Cottonwood Trail
- 3868 Munson St Unit 7284
- 3870 Munson St Unit 7283
- 3872 Munson St Unit 7282
- 3874 Munson St Unit 7281
- 3874 Munson St Unit 3874
- 3868 Munson St Unit 4
- 3870 Munson St Unit 3
- 3874 Munson St Unit 1
- 3929 Pratt St Unit 7273
- 3927 Pratt St Unit 7272
- 3925 Pratt St Unit 7271
- 3860 Munson St Unit 7294
- 3862 Munson St Unit 7293
- 3864 Munson St Unit 7292
- 3866 Munson St Unit 7291
- 3932 Pratt St Unit 7144
- 3934 Pratt St Unit 7143
- 3936 Pratt St Unit 7142
- 3938 Pratt St Unit 7141
- 3932 Pratt St Unit 3932
Your Personal Tour Guide
Ask me questions while you tour the home.