Estimated Value: $694,140 - $779,000
3
Beds
3
Baths
2,404
Sq Ft
$306/Sq Ft
Est. Value
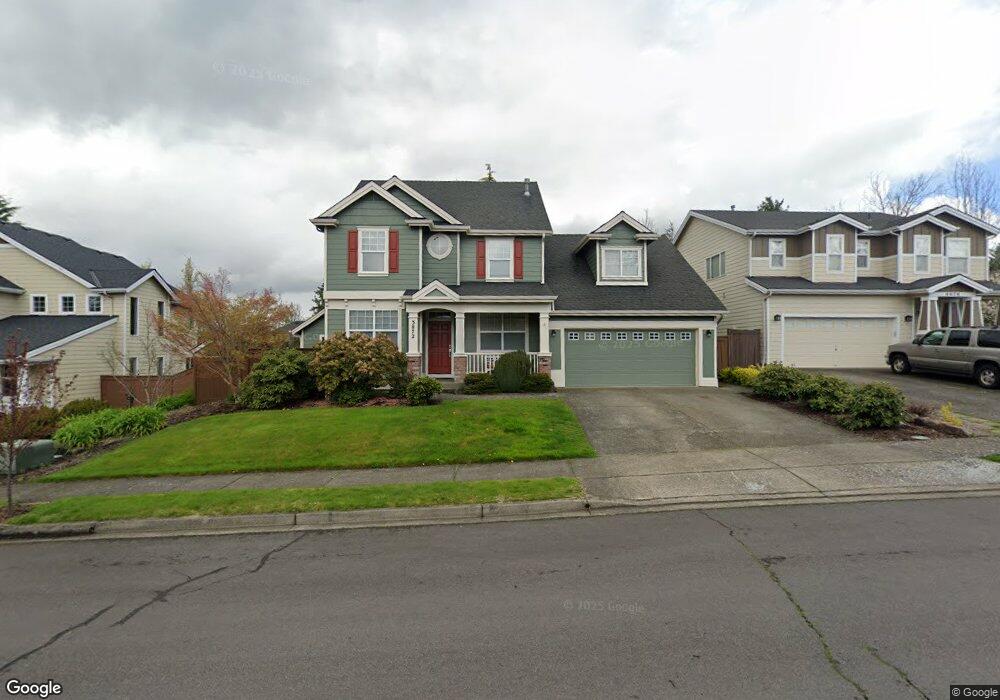
About This Home
This home is located at 3872 NW 9th Loop, Camas, WA 98607 and is currently estimated at $734,785, approximately $305 per square foot. 3872 NW 9th Loop is a home located in Clark County with nearby schools including Prune Hill Elementary School, Skyridge Middle School, and Camas High School.
Ownership History
Date
Name
Owned For
Owner Type
Purchase Details
Closed on
Sep 25, 2008
Sold by
Macdonna J and Krebsbach Donna J
Bought by
Krebsbach Paul B
Current Estimated Value
Purchase Details
Closed on
Jan 25, 2001
Sold by
Saltzberg David M and Griggs Saltzberg Karen L
Bought by
Krebsbach Paul B and Krebsbach Donna J
Home Financials for this Owner
Home Financials are based on the most recent Mortgage that was taken out on this home.
Original Mortgage
$196,400
Outstanding Balance
$72,693
Interest Rate
7.41%
Estimated Equity
$662,092
Purchase Details
Closed on
Feb 8, 1999
Sold by
Lugliani Investment Company Llc
Bought by
Saltzberg David M and Griggs Saltzberg Karen L
Home Financials for this Owner
Home Financials are based on the most recent Mortgage that was taken out on this home.
Original Mortgage
$160,700
Interest Rate
6.79%
Create a Home Valuation Report for This Property
The Home Valuation Report is an in-depth analysis detailing your home's value as well as a comparison with similar homes in the area
Purchase History
| Date | Buyer | Sale Price | Title Company |
|---|---|---|---|
| Krebsbach Paul B | -- | None Available | |
| Krebsbach Paul B | $246,000 | Charter Title Corporation | |
| Saltzberg David M | $244,354 | Transnation Title Insurance |
Source: Public Records
Mortgage History
| Date | Status | Borrower | Loan Amount |
|---|---|---|---|
| Open | Krebsbach Paul B | $196,400 | |
| Previous Owner | Saltzberg David M | $160,700 | |
| Closed | Krebsbach Paul B | $25,000 |
Source: Public Records
Tax History
| Year | Tax Paid | Tax Assessment Tax Assessment Total Assessment is a certain percentage of the fair market value that is determined by local assessors to be the total taxable value of land and additions on the property. | Land | Improvement |
|---|---|---|---|---|
| 2025 | $5,852 | $570,425 | $170,000 | $400,425 |
| 2024 | $5,937 | $613,889 | $229,500 | $384,389 |
| 2023 | $5,946 | $669,647 | $246,500 | $423,147 |
| 2022 | $5,856 | $637,740 | $234,600 | $403,140 |
| 2021 | $5,600 | $525,008 | $192,100 | $332,908 |
| 2020 | $5,978 | $465,361 | $170,000 | $295,361 |
| 2019 | $5,479 | $460,649 | $170,000 | $290,649 |
| 2018 | $5,557 | $449,736 | $0 | $0 |
| 2017 | $4,966 | $383,417 | $0 | $0 |
| 2016 | $4,666 | $373,108 | $0 | $0 |
| 2015 | $4,569 | $348,821 | $0 | $0 |
| 2014 | -- | $322,027 | $0 | $0 |
| 2013 | -- | $281,034 | $0 | $0 |
Source: Public Records
Map
Nearby Homes
- 4030 NW Quinault St
- 845 NW Sacajawea St
- 3983 NW 64th Ave Unit 22
- 3983 NW 64th Ave
- 693 NW Halifax St Unit LOT 9
- 667 NW Halifax St Unit LOT 8
- 558 NW Halifax St Unit LOT 17
- 501 NW Halifax St Unit LOT 3
- 3345 NW 14th Ave
- 0 NW Halifax Unit Lot 6 24459237
- 645 NW Halifax St Unit Lot 7
- 533 NW Halifax St
- 630 NW Halifax St Unit Lot 15
- 645 NW Garden Ct Unit LOT 20
- 600 NW Halifax St Unit LOT 16
- 703 NW Garden Ct Unit LOT 19
- 682 NW Ct Unit Lot 26
- 3038 NW 12th Ave
- 3538 NW 17th Ave
- 3270 NW 17th Ave
- 3868 NW 9th Loop
- 3876 NW 9th Loop
- 3718 NW 9th Loop
- 3700 NW 9th Loop
- 3736 NW 9th Loop
- 3864 NW 9th Loop
- 3875 NW 9th Loop
- 3871 NW 9th Loop
- 3748 NW 9th Loop
- 3879 NW 9th Loop
- 3867 NW 9th Loop
- 3883 NW 9th Loop
- 3860 NW 9th Loop
- 3808 NW 9th Loop
- 3887 NW 9th Loop
- 3863 NW 9th Loop
- 3628 NW 8th Ct
- 3634 NW Mcintosh Rd
- 0 NW Mcintosh Rd Unit 13109684
- 0 NW Mcintosh Rd Unit 32 18026416
Your Personal Tour Guide
Ask me questions while you tour the home.