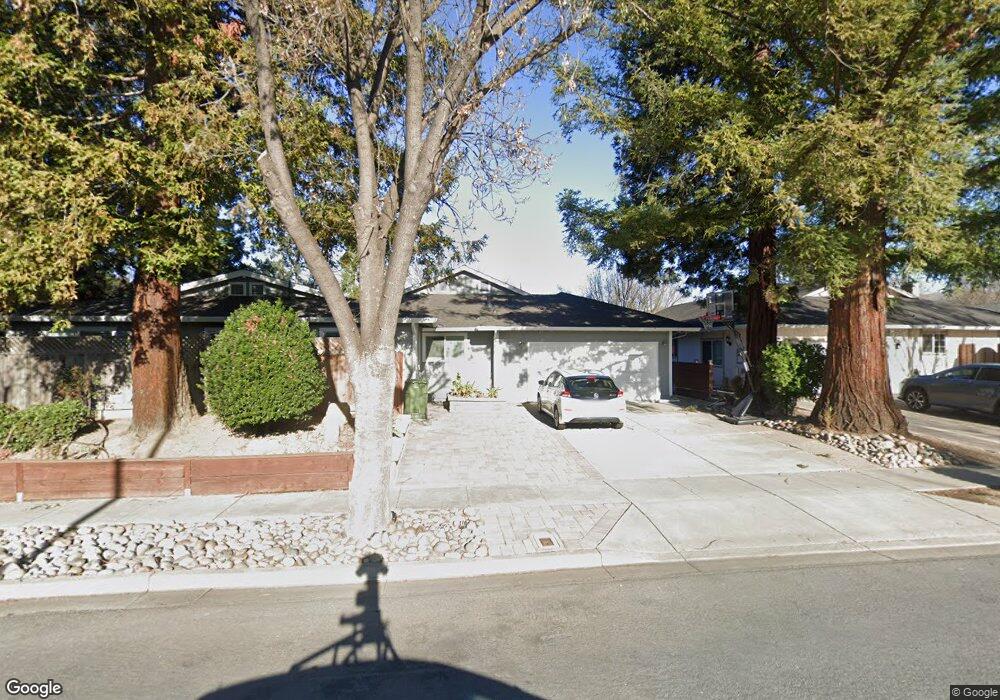
38720 Greenwich Cir Fremont, CA 94536
Cherry-Guardino NeighborhoodEstimated Value: $1,379,000 - $1,812,414
2
Beds
2
Baths
1,323
Sq Ft
$1,217/Sq Ft
Est. Value
About This Home
This home is located at 38720 Greenwich Cir, Fremont, CA 94536 and is currently estimated at $1,610,354, approximately $1,217 per square foot. 38720 Greenwich Cir is a home located in Alameda County with nearby schools including Parkmont Elementary School, Centerville Junior High School, and Washington High School.
Ownership History
Date
Name
Owned For
Owner Type
Purchase Details
Closed on
Mar 3, 2021
Sold by
Yu Johnny Y and Yu Kie Q
Bought by
Yu Johnny Y and Yu Kie Q
Current Estimated Value
Home Financials for this Owner
Home Financials are based on the most recent Mortgage that was taken out on this home.
Original Mortgage
$592,000
Outstanding Balance
$530,686
Interest Rate
2.7%
Mortgage Type
New Conventional
Estimated Equity
$1,079,668
Purchase Details
Closed on
Sep 1, 2020
Sold by
Yu Johnny Y and Yu Kie Q
Bought by
Yu Johnny Y and Yu Kie Q
Home Financials for this Owner
Home Financials are based on the most recent Mortgage that was taken out on this home.
Original Mortgage
$599,000
Interest Rate
2.9%
Mortgage Type
New Conventional
Purchase Details
Closed on
Feb 14, 2020
Sold by
Yu Johnny and Yu Kie Q
Bought by
Yu Johnny Y and Yu Kie Q
Home Financials for this Owner
Home Financials are based on the most recent Mortgage that was taken out on this home.
Original Mortgage
$608,000
Interest Rate
3.6%
Mortgage Type
New Conventional
Purchase Details
Closed on
Sep 22, 2017
Sold by
Chieng Yu Johnny Y and Chieng Yu Kie Q
Bought by
Yu Johnny Y and Chieng Yu Kie Q
Home Financials for this Owner
Home Financials are based on the most recent Mortgage that was taken out on this home.
Original Mortgage
$636,000
Interest Rate
3.89%
Mortgage Type
New Conventional
Purchase Details
Closed on
Jul 10, 2017
Sold by
Pak Soni and Kim Hong Suk
Bought by
Chieng Yu Johnny Y and Chieng Yu Kie Q
Home Financials for this Owner
Home Financials are based on the most recent Mortgage that was taken out on this home.
Original Mortgage
$660,000
Interest Rate
3.94%
Mortgage Type
New Conventional
Purchase Details
Closed on
Nov 14, 2016
Sold by
Pak Soni
Bought by
Pak Soni and Kim Hong Suk
Purchase Details
Closed on
Apr 1, 2004
Sold by
Dastur Meher
Bought by
Pak Soni
Home Financials for this Owner
Home Financials are based on the most recent Mortgage that was taken out on this home.
Original Mortgage
$380,000
Interest Rate
4.5%
Mortgage Type
Purchase Money Mortgage
Purchase Details
Closed on
Mar 23, 1994
Sold by
Serventi James R
Bought by
Dastur Meher N
Home Financials for this Owner
Home Financials are based on the most recent Mortgage that was taken out on this home.
Original Mortgage
$147,200
Interest Rate
7.15%
Purchase Details
Closed on
Sep 24, 1993
Sold by
Page S Gene
Bought by
Serventi James R
Create a Home Valuation Report for This Property
The Home Valuation Report is an in-depth analysis detailing your home's value as well as a comparison with similar homes in the area
Home Values in the Area
Average Home Value in this Area
Purchase History
| Date | Buyer | Sale Price | Title Company |
|---|---|---|---|
| Yu Johnny Y | -- | Chicago Title Company | |
| Yu Johnny Y | -- | Chicago Title Company | |
| Yu Johnny Y | -- | Chicago Title Company | |
| Yu Johnny Y | -- | Chicago Title Company | |
| Yu Johnny Y | -- | Chicago Title Company | |
| Yu Johnny | -- | Chicago Title Company | |
| Yu Johnny Y | -- | Chicago Title Company | |
| Yu Johnny Y | -- | Chicago Title Company | |
| Chieng Yu Johnny Y | $911,000 | Chicago Title Company | |
| Pak Soni | -- | None Available | |
| Pak Soni | $478,000 | Chicago Title Company | |
| Dastur Meher N | $184,000 | American Title Insurance Co | |
| Serventi James R | -- | American Title Co |
Source: Public Records
Mortgage History
| Date | Status | Borrower | Loan Amount |
|---|---|---|---|
| Open | Yu Johnny Y | $592,000 | |
| Closed | Yu Johnny Y | $599,000 | |
| Closed | Yu Johnny | $608,000 | |
| Closed | Yu Johnny Y | $636,000 | |
| Closed | Chieng Yu Johnny Y | $660,000 | |
| Previous Owner | Pak Soni | $380,000 | |
| Previous Owner | Dastur Meher N | $147,200 | |
| Closed | Pak Soni | $50,000 |
Source: Public Records
Tax History Compared to Growth
Tax History
| Year | Tax Paid | Tax Assessment Tax Assessment Total Assessment is a certain percentage of the fair market value that is determined by local assessors to be the total taxable value of land and additions on the property. | Land | Improvement |
|---|---|---|---|---|
| 2025 | $13,442 | $1,136,632 | $398,233 | $745,399 |
| 2024 | $13,442 | $1,114,208 | $390,425 | $730,783 |
| 2023 | $13,089 | $1,099,226 | $382,770 | $716,456 |
| 2022 | $12,931 | $1,070,676 | $375,266 | $702,410 |
| 2021 | $12,610 | $1,049,549 | $367,909 | $688,640 |
| 2020 | $12,682 | $1,045,724 | $364,140 | $681,584 |
| 2019 | $12,535 | $1,025,220 | $357,000 | $668,220 |
| 2018 | $11,189 | $911,000 | $350,000 | $561,000 |
| 2017 | $7,410 | $585,558 | $175,667 | $409,891 |
| 2016 | $7,282 | $574,077 | $172,223 | $401,854 |
| 2015 | $7,183 | $565,454 | $169,636 | $395,818 |
| 2014 | $5,863 | $453,000 | $135,900 | $317,100 |
Source: Public Records
Map
Nearby Homes
- 38780 Tyson Ln Unit 205C
- 38780 Tyson Ln Unit 305C
- 1225 Koi Terrace
- 38784 Huntington Cir
- 38538 Tyson Ln
- 38697 Huntington Cir
- 957 Huntington Common
- 38605 Vancouver Common
- 952 Cherry Glen Terrace
- 38627 Cherry Ln Unit 71
- 38623 Cherry Ln Unit 203
- 38623 Cherry Ln Unit 201
- 38623 Cherry Ln Unit 148
- 38623 Cherry Ln Unit 175
- 1145 Bennett Ct
- 39239 Walnut Terrace
- 874 Cherry Glen Cir Unit 111
- 38721 Cherry Ln
- 38851 Stillwater Common
- 39149 Guardino Dr Unit 247
- 38676 Greenwich Cir
- 38728 Greenwich Cir
- 38670 Greenwich Cir
- 38719 Greenwich Cir
- 38723 Greenwich Cir
- 38715 Greenwich Cir
- 38695 Greenwich Cir
- 38699 Greenwich Cir
- 38727 Greenwich Cir
- 38691 Greenwich Cir
- 38734 Greenwich Cir
- 38703 Greenwich Cir
- 38664 Greenwich Cir
- 38711 Greenwich Cir
- 38731 Greenwich Cir
- 38687 Greenwich Cir
- 38679 Greenwich Cir
- 38675 Greenwich Cir
- 38802 Litchfield Cir
- 38798 Litchfield Cir