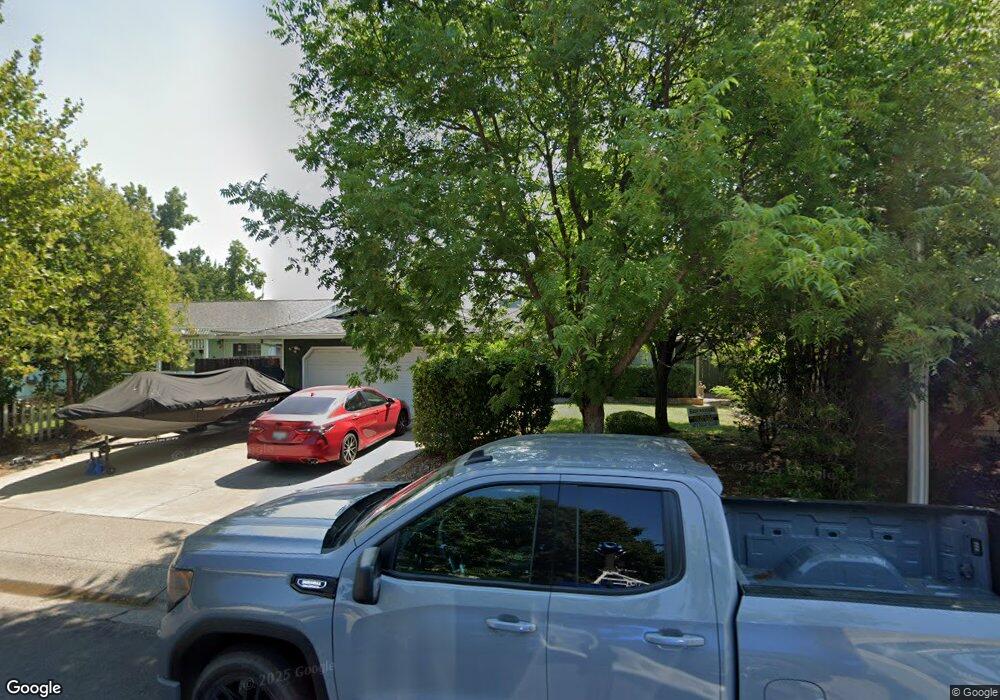
3873 Capricorn Way Redding, CA 96002
Starview NeighborhoodEstimated Value: $320,000 - $343,000
3
Beds
2
Baths
1,238
Sq Ft
$266/Sq Ft
Est. Value
About This Home
This home is located at 3873 Capricorn Way, Redding, CA 96002 and is currently estimated at $329,776, approximately $266 per square foot. 3873 Capricorn Way is a home located in Shasta County with nearby schools including Alta Mesa Elementary School, Parsons Junior High School, and Enterprise High School.
Ownership History
Date
Name
Owned For
Owner Type
Purchase Details
Closed on
Aug 17, 2009
Sold by
Deutsche Bank National Trust Company
Bought by
Lindberg Jesse L
Current Estimated Value
Home Financials for this Owner
Home Financials are based on the most recent Mortgage that was taken out on this home.
Original Mortgage
$144,730
Interest Rate
5%
Mortgage Type
FHA
Purchase Details
Closed on
Jul 6, 2009
Sold by
King Rochelle M
Bought by
Deutsche Bank National Trust Company
Home Financials for this Owner
Home Financials are based on the most recent Mortgage that was taken out on this home.
Original Mortgage
$144,730
Interest Rate
5%
Mortgage Type
FHA
Purchase Details
Closed on
Jun 8, 2005
Sold by
King Randahl J
Bought by
King Rochelle M
Create a Home Valuation Report for This Property
The Home Valuation Report is an in-depth analysis detailing your home's value as well as a comparison with similar homes in the area
Home Values in the Area
Average Home Value in this Area
Purchase History
| Date | Buyer | Sale Price | Title Company |
|---|---|---|---|
| Lindberg Jesse L | $147,500 | Chicago Title Insurance Co | |
| Deutsche Bank National Trust Company | $132,201 | None Available | |
| King Rochelle M | -- | New Century Title Company |
Source: Public Records
Mortgage History
| Date | Status | Borrower | Loan Amount |
|---|---|---|---|
| Previous Owner | Lindberg Jesse L | $144,730 |
Source: Public Records
Tax History Compared to Growth
Tax History
| Year | Tax Paid | Tax Assessment Tax Assessment Total Assessment is a certain percentage of the fair market value that is determined by local assessors to be the total taxable value of land and additions on the property. | Land | Improvement |
|---|---|---|---|---|
| 2025 | $2,082 | $190,252 | $58,078 | $132,174 |
| 2024 | $2,053 | $186,523 | $56,940 | $129,583 |
| 2023 | $2,053 | $182,867 | $55,824 | $127,043 |
| 2022 | $1,995 | $179,282 | $54,730 | $124,552 |
| 2021 | $1,927 | $175,767 | $53,657 | $122,110 |
| 2020 | $1,918 | $173,965 | $53,107 | $120,858 |
| 2019 | $1,903 | $170,555 | $52,066 | $118,489 |
| 2018 | $1,881 | $167,212 | $51,046 | $116,166 |
| 2017 | $1,914 | $163,935 | $50,046 | $113,889 |
| 2016 | $1,791 | $160,721 | $49,065 | $111,656 |
| 2015 | $1,776 | $158,307 | $48,328 | $109,979 |
| 2014 | $1,763 | $155,207 | $47,382 | $107,825 |
Source: Public Records
Map
Nearby Homes
- 3849 Capricorn Way
- 3688 Polaris Way
- 2408 Castlewood Dr
- 3512 Capricorn Way
- 2269 Corona St
- 4151 Saratoga Dr
- 3792 Thomason Trail
- 2145 Venus Way
- 3387 Bridger Dr
- 2068 Solar Way
- 3361 Alta Mesa Dr
- 3685 Wimbledon Dr
- 0 Shasta View Unit 25-1945
- 2796 Madison River Dr
- 3195 Forest Hills Dr
- 3149 Leonard St
- 2366 Templeton Dr
- 3160 Sinaloa Trail
- 3897 Sunwood Dr
- 3341 Timbercreek Dr
- 3891 Capricorn Way
- 3811 Capricorn Way
- 2583 Celestial St
- 2592 Galaxy Way
- 3781 Capricorn Way
- 2750 Galaxy Way
- 2603 Galaxy Way
- 2569 Celestial St
- 2578 Galaxy Way
- 2590 Celestial St
- 3765 Capricorn Way
- 2585 Galaxy Way
- 3921 Capricorn Way
- 2557 Celestial St
- 2574 Celestial St
- 2564 Galaxy Way Unit 1
- 2564 Galaxy Way
- 3906 Bristol Dr
- 2808 Galaxy Way
- 3759 Capricorn Way