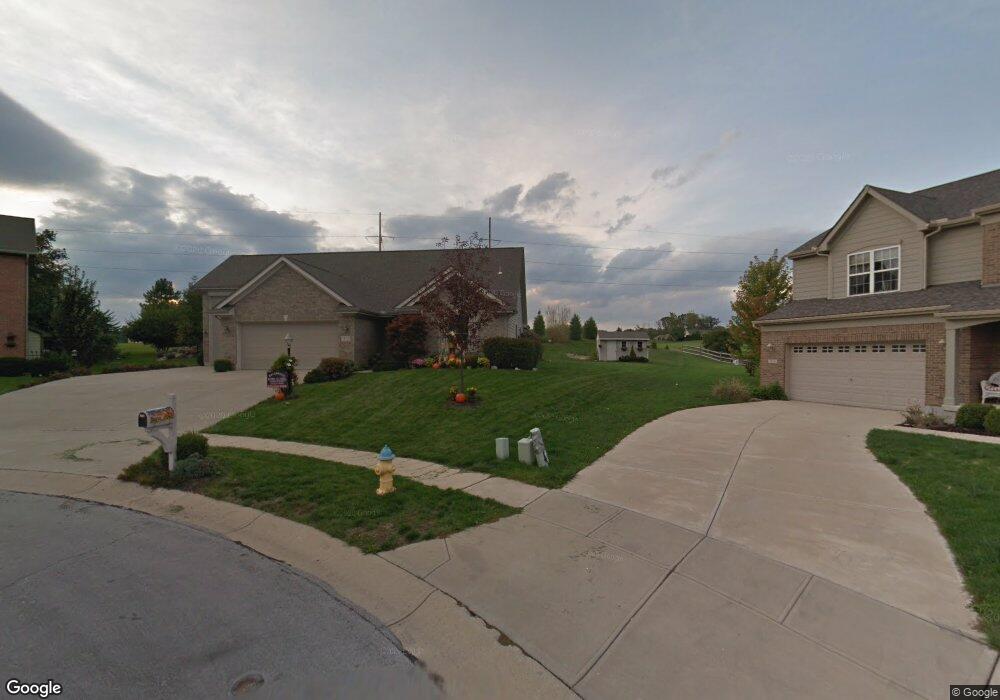
3874 W Sudbury Ct Bellbrook, OH 45305
Estimated Value: $337,308 - $394,000
3
Beds
2
Baths
1,482
Sq Ft
$254/Sq Ft
Est. Value
About This Home
This home is located at 3874 W Sudbury Ct, Bellbrook, OH 45305 and is currently estimated at $376,577, approximately $254 per square foot. 3874 W Sudbury Ct is a home located in Greene County with nearby schools including Stephen Bell Elementary School, Bell Creek Intermediate School, and Bellbrook Middle School.
Ownership History
Date
Name
Owned For
Owner Type
Purchase Details
Closed on
Aug 27, 2015
Sold by
Depew Eddie G and Depew Carolyn L
Bought by
Keeton Jeremy L and Keeton Julia C
Current Estimated Value
Home Financials for this Owner
Home Financials are based on the most recent Mortgage that was taken out on this home.
Original Mortgage
$2,100,000
Outstanding Balance
$1,652,783
Interest Rate
3.97%
Mortgage Type
VA
Estimated Equity
-$1,276,206
Purchase Details
Closed on
Apr 15, 2005
Sold by
E E Wood Homes Inc
Bought by
Depew Eddie G and Depew Carolyn L
Home Financials for this Owner
Home Financials are based on the most recent Mortgage that was taken out on this home.
Original Mortgage
$125,000
Interest Rate
6.06%
Mortgage Type
Unknown
Purchase Details
Closed on
Aug 20, 2004
Sold by
Bellbrook Land Co
Bought by
E E Wood Homes Inc
Create a Home Valuation Report for This Property
The Home Valuation Report is an in-depth analysis detailing your home's value as well as a comparison with similar homes in the area
Home Values in the Area
Average Home Value in this Area
Purchase History
| Date | Buyer | Sale Price | Title Company |
|---|---|---|---|
| Keeton Jeremy L | $210,000 | Attorney | |
| Depew Eddie G | $213,000 | -- | |
| E E Wood Homes Inc | $42,000 | -- |
Source: Public Records
Mortgage History
| Date | Status | Borrower | Loan Amount |
|---|---|---|---|
| Open | Keeton Jeremy L | $2,100,000 | |
| Previous Owner | Depew Eddie G | $125,000 |
Source: Public Records
Tax History Compared to Growth
Tax History
| Year | Tax Paid | Tax Assessment Tax Assessment Total Assessment is a certain percentage of the fair market value that is determined by local assessors to be the total taxable value of land and additions on the property. | Land | Improvement |
|---|---|---|---|---|
| 2024 | $5,482 | $95,410 | $18,370 | $77,040 |
| 2023 | $5,482 | $95,410 | $18,370 | $77,040 |
| 2022 | $5,542 | $78,690 | $15,310 | $63,380 |
| 2021 | $5,442 | $76,490 | $15,310 | $61,180 |
| 2020 | $5,094 | $76,490 | $15,310 | $61,180 |
| 2019 | $4,970 | $67,800 | $14,690 | $53,110 |
| 2018 | $4,975 | $67,800 | $14,690 | $53,110 |
| 2017 | $4,812 | $67,800 | $14,690 | $53,110 |
| 2016 | $4,812 | $64,950 | $14,690 | $50,260 |
| 2015 | $4,072 | $64,950 | $14,690 | $50,260 |
| 2014 | $3,772 | $64,950 | $14,690 | $50,260 |
Source: Public Records
Map
Nearby Homes
- 3852 W Franklin St
- 2042 Wentworth Village Dr Unit 2042
- 3849 Sable Ridge Dr
- 3930 Beechwood Dr
- 1939 Sugar Run Trail
- 1713 Fox Trail
- 2317 Barnett Dr
- 1667 Ardennes Oak Dr
- 3553 Shellbark Dr
- 2215 S Linda Dr
- 3656 Persimmon Ridge Place
- 3509 Marwood Dr
- 3604 Cypress Pointe Dr
- 3604 Cypress Pointe Dr
- 144 Upper Hillside Dr
- 1478 Kensington Dr
- 161 Belair Cir
- 4198 N Golden Clove Bend Unit 56-304
- 4206 N Golden Clove Bend Unit 56-303
- 4204 N Golden Clove Bend Unit 56-305
- 3870 W Sudbury Ct
- 3875 W Sudbury Ct
- 3863 Callaway Ct
- 3864 W Sudbury Ct
- 3871 W Sudbury Ct
- 3859 Callaway Ct
- 3866 Callaway Ct
- 3867 W Sudbury Ct
- 3854 W Sudbury Ct
- 3894 W Franklin St
- 3853 Callaway Ct
- 3857 W Sudbury Ct
- 3878 W Franklin St
- 3862 Callaway Ct
- 3846 W Sudbury Ct
- 3868 W Franklin St
- 3851 W Sudbury Ct
- 3854 Callaway Ct
- 3860 W Franklin St
- 3865 Polo Trace Ct