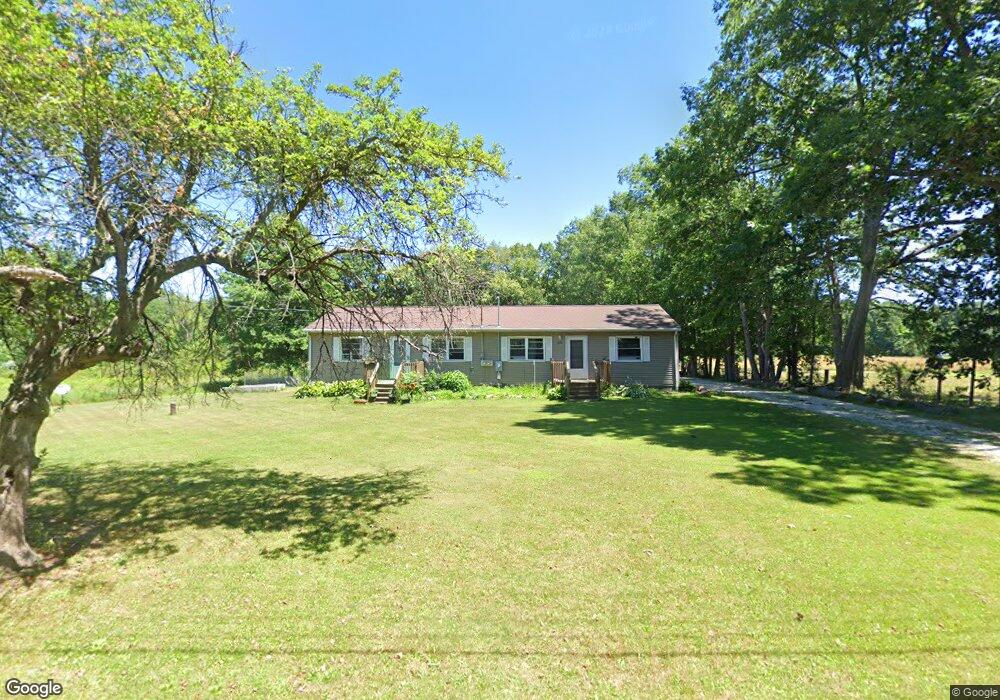
3876 Porter Rd Rootstown, OH 44272
Estimated Value: $203,163 - $242,000
4
Beds
2
Baths
1,560
Sq Ft
$142/Sq Ft
Est. Value
About This Home
This home is located at 3876 Porter Rd, Rootstown, OH 44272 and is currently estimated at $221,041, approximately $141 per square foot. 3876 Porter Rd is a home located in Portage County with nearby schools including Southeast High School.
Ownership History
Date
Name
Owned For
Owner Type
Purchase Details
Closed on
Jun 28, 2022
Sold by
Cabriolet Property Management Llc
Bought by
Duffy Michael
Current Estimated Value
Home Financials for this Owner
Home Financials are based on the most recent Mortgage that was taken out on this home.
Original Mortgage
$165,938
Outstanding Balance
$158,088
Interest Rate
5.25%
Mortgage Type
FHA
Estimated Equity
$62,953
Purchase Details
Closed on
Mar 9, 2012
Sold by
Dillon Robin M and Dillon Diane M
Bought by
Dillon Robin and Dillon Diane
Purchase Details
Closed on
Oct 13, 2005
Sold by
Bryant Craig J and Bryant Rachel M
Bought by
Dillon Robin M and Dillon Diane M
Purchase Details
Closed on
Jun 16, 1997
Sold by
Hamilton Durrell L
Bought by
Bryant Craig T and Bryant Rachel M
Home Financials for this Owner
Home Financials are based on the most recent Mortgage that was taken out on this home.
Original Mortgage
$102,863
Interest Rate
8.13%
Mortgage Type
FHA
Create a Home Valuation Report for This Property
The Home Valuation Report is an in-depth analysis detailing your home's value as well as a comparison with similar homes in the area
Purchase History
| Date | Buyer | Sale Price | Title Company |
|---|---|---|---|
| Duffy Michael | $169,000 | Golubski David M | |
| Cabriolet Property Management Llc | $125 | Golubski David M | |
| Dillon Robin | -- | Attorney | |
| Dillon Robin M | $112,000 | Approved Statewide Title | |
| Bryant Craig T | $105,000 | -- |
Source: Public Records
Mortgage History
| Date | Status | Borrower | Loan Amount |
|---|---|---|---|
| Open | Duffy Michael | $165,938 | |
| Previous Owner | Bryant Craig T | $102,863 |
Source: Public Records
Tax History
| Year | Tax Paid | Tax Assessment Tax Assessment Total Assessment is a certain percentage of the fair market value that is determined by local assessors to be the total taxable value of land and additions on the property. | Land | Improvement |
|---|---|---|---|---|
| 2025 | $2,383 | $63,080 | $9,350 | $53,730 |
| 2024 | $2,328 | $63,080 | $9,350 | $53,730 |
| 2023 | $1,846 | $44,670 | $8,090 | $36,580 |
| 2022 | $1,938 | $44,670 | $8,090 | $36,580 |
| 2021 | $1,954 | $44,670 | $8,090 | $36,580 |
| 2020 | $1,761 | $38,610 | $7,350 | $31,260 |
| 2019 | $1,765 | $38,610 | $7,350 | $31,260 |
| 2018 | $1,613 | $33,190 | $7,110 | $26,080 |
| 2017 | $1,613 | $33,190 | $7,110 | $26,080 |
| 2016 | $1,607 | $33,190 | $7,110 | $26,080 |
| 2015 | $1,541 | $33,190 | $7,110 | $26,080 |
| 2014 | $1,508 | $31,720 | $7,110 | $24,610 |
| 2013 | $1,472 | $31,720 | $7,110 | $24,610 |
Source: Public Records
Map
Nearby Homes
- 3545 Porter Rd
- 3798 State Route 183
- 6747 Giddings Rd
- 8464 & 8446 Tallmadge Rd
- 8492 & 8476 Tallmadge Rd
- 2639 Ohio 183
- 4087 Industry
- 0 John Thomas
- 0 Wayland Rd Unit 5191883
- 0 Yale Rd Unit 5190725
- 4133 State Route 225
- 3609 State Route 225
- 0 Ohio 225 Unit 5174573
- 3207 Prairie Cir
- 2434 Taft Ave
- 941 Porter Rd
- 0 Tallmadge Rd Unit 5189301
- 0 Tallmadge Rd Unit 5189314
- 9672 Whippoorwill Rd
- 6605 State Route 5
Your Personal Tour Guide
Ask me questions while you tour the home.